
Outros Relatórios SNEL11 de 30/09/2026
Outros Relatórios do Suno Energias Limpas IS (SNEL11), fundo imobiliário de fundos (FoF), com data de referência em 30/09/2026, com entrega no FundosNet (B3) em 22/10/2026. No pregão de 03/11/2026, a cota do SNEL11 fechou a R$ 7,38, com P/VP de 0,92 (valor patrimonial de R$ 7,99 por cota no informe mensal de setembro de 2026). O último rendimento foi de R$ 0,10 por cota, com pagamento em out/2026, e o dividend yield dos últimos 12 meses é de 14,91% sobre a cotação de 03/11/2026. O patrimônio líquido era de R$ 1,8 bilhão no informe mensal de setembro de 2026. Os indicadores são os mais recentes da base do Kartac, não os do período do documento.
Informações
- CNPJ
- 43.741.171/0001-84
- Tipo
- Relatórios
- Assunto
- Outros Relatórios
- Data de referência
- 30/09/2026
- Data de entrega
- 22/10/2026 20:28
- Versão
- 1
- Situação
- (Ativo)
Conteúdo
A S S E T ENIOU RAS ANNEEEE SAS ENIO ANINTE SACAS o e
M A N A G E M E N T R E P O R T September 2026 E ERRA
ANNUALIZED DY
DISTRIBUTION/UNIT
R$ 0.10
NET ASSET VALUE
R$ 1,814.7 MM 66 solar plants – 266.2 MWp
15.99% based on market price
CONTENTS
| Executive Summary· · · · · · · · · · · · · | 03 |
|---|---|
| Investment Thesis· · · · · · · · · · · · · · · · · | 04 |
| Energy Column· · · · · · · · · · · · · · · · · · · · | 05 |
| Manager's Letter· · · · · · · · · · · · · · · · · · | 06 |
| Portfolio Performance· · · · · · · · · · | 08 |
| Portfolio Summary· · · · · · · · · · · · · · · | 09 |
| Asset Details· · · · · · · · · · · · · · · · · · · · · · · | 10 |
| Performance and Results· · · · · | 12 |
| Suno Asset· · · · · · · · · · · · · · · · · · · · · · · · · · | 14 |
| Disclaimer· · · · · · · · · · · · · · · · · · | 15 |
SNEL11 Management Report — September/2026
EXECUTIVE SUMMARY
/>
Manager
Suno Gestora de Recursos Ltda.
Administrator
QI Corretora de Títulos e Valores Mobiliários S.A. Fund Inception December/2022
Performance Fee 20% above (IPCA + 7%) Management Fee 1.08% p.a. Administration Fee 0.12% p.a.
MONTHLY HIGHLIGHTS
As per the Material Fact released on September 17, the Fund formalized the acquisition of 29 solar distributed generation real estate projects. The assets total 116.7 MWp of peak power and 84.45 MW of installed capacity, and the total transaction amount is R$ 565,038,033.83.
September's IPCA, released by IBGE on October 9, rose 0.82% in the month, above the market expectation of 0.73%. The 12-month cumulative �gure reached 4.58%. Residential electricity rose 7.98% in the month, a move attributed to the end of the Itaipu Bonus, which had been credited on August electricity bills.
The highlights of the month were the Paramirim and São Gabriel do Oeste solar plants. Paramirim posted record generation of 1,143 MWh, up 48% from the previous month. São Gabriel do Oeste, in turn, reached 209 MWh, growth of 27% on the same basis of comparison.
We completed the closing of the São Tiago solar plant, with 3.5 MWp of capacity. With the closing, ownership of the asset is transferred to SNEL11, and the plant is incorporated into the operating portfolio. The project already has a contracted tenant, NUV, and 37.5% of its commercial ramp-up has been completed.
Dividend Yield (annualized) Net Asset Value Distribution per unit 15.99% R$ 1,814.7 MM R$ 0.10 No. of Projects P/BV Market/Book Unit Price 66 1.01 R$ 8.04/R$ 7.99 (Incl. assets under acquisition) Installed Capacity Market Value Cash and Equivalents 266.2 MWp R$ 1,825.3 MM R$ 594.4 MM (Incl. assets under acquisition) (31% of Assets) Accumulated Profit per unit Total Return (Month) Number of shareholders R$ 0.004 -1.45% 141,612 (Excludes 5th Offering Receipts)
INVESTMENT THESIS
/>
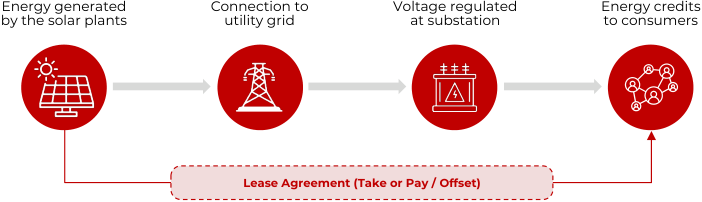
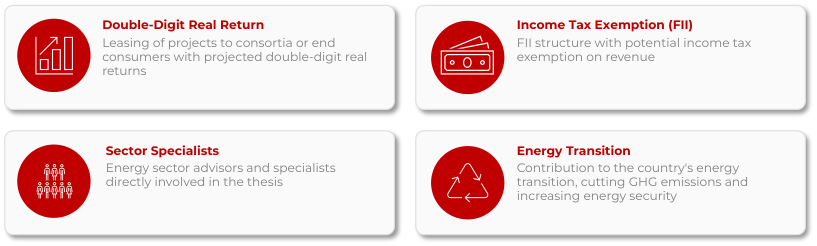
SNEL11 is a real estate fund (FII) focused on real estate projects tied to clean energy generation, with long-term lease agreements, providing predictability and stability in revenue generation.
The Manager's work ranges from technical analysis and initial assessment of projects, through legal due diligence conducted by specialized third-party law �rms, to the ongoing monitoring and operation of the assets.
PROJECT STRUCTURE
INVESTMENT PROCESS

ADVANTAGES OF THE THESIS
ENERGY COLUMN
/>
Opening of the Free Market Can Strengthen DG
Brazil is preparing for a new stage in the transformation of its electricity sector. By expanding freedom of choice and making energy procurement a more present part of consumers' decisions, the opening of the Free Market tends to stimulate demand for solutions capable of reducing the electricity bill. Although this movement increases competition, it may also create opportunities for distributed generation (DG), which already has a relevant customer base, commercial experience and a consolidated savings model. The competition will not be decided by energy price alone, but by the savings effectively perceived by the consumer.
The 20% to 22% reduction frequently associated with migrating to the Free Market needs to be interpreted with care. This percentage refers to the energy component, and not necessarily to the entire bill. The consumer will continue to pay for use of the distribution network, sector charges and applicable taxes. If energy represents 40% of the bill, for example, a 21% reduction in that component would correspond to savings of approximately 8.4% on the total bill, before considering other effects. This is an illustrative simulation, since the tariff composition varies according to the distribution utility and the consumption pro�le.
Shared distributed generation follows a different logic. Energy credits can reduce bill components that remain on the bills of consumers who migrate to the Free Market, subject to the applicable compensation rules. For projects subject to the transition set out in Law 14,300/2022, however, there is a progressive charge for use of the grid, including the applicable portion of the “Fio B” (distribution wire) component. The comparison must therefore consider the �nal cost of both models, and not just the contracted price per megawatt-hour. A cheaper offer in the Free Market may be attractive, but it does not necessarily represent the lowest bill.
There is also a structural issue. Consumer migration reduces the load served by distribution utilities in the regulated market, but does not eliminate the costs of energy contracts already undertaken or grid maintenance costs. Law 15,269/2025 provides for the apportionment of the �nancial effects of over-contracting or involuntary exposure resulting from consumer migration between the regulated and free environments, through a charge proportional to consumption. The regulation and the way these costs are allocated will be important in determining their actual impact on each consumer.
For DG, this scenario may represent an opportunity. If new charges put pressure on tariff components that can be offset by energy credits, the economic value of distributed generation may increase. This effect is not automatic and will depend on allocation and billing rules, but it reinforces the importance of comparing the models by the net savings delivered to the consumer, and not just by energy price. Another advantage lies in operational �exibility. Under the Electric Energy Compensation System (SCEE), credits can be used for up to 60 months, making it possible to manage differences between generation and consumption periods. In the Free Market, energy traders need to balance contracted energy with their customers' actual demand. Differences between contracted and realized volumes can generate �nancial exposure in the Short-Term Market. DG also faces sizing and surplus risks, but the possibility of using credits over time offers an additional tool for managing these differences.
The opening may also stimulate the evolution of business models, creating space for energy solution aggregators capable of bringing together different alternatives and offering the most suitable combination for each consumer. Building on already established customer relationships, companies in the sector will be able to integrate shared generation, Free Market energy procurement through authorized agents, consumption management, batteries and technology platforms. The goal is no longer just to offer a discount, but to deliver a more ef�cient and personalized energy solution.
In this context, plants classi�ed under GD I may become strategic assets, since Law 14,300/2022 guarantees an energy credit compensation rule that can give the portfolio greater competitiveness. This protection does not represent automatic immunity to new charges, but it constitutes a relevant regulatory differentiator in structuring solutions for consumers. The opening of the Free Market may thus expand the addressable market and accelerate demand for more �exible and personalized energy solutions. For DG companies, the challenge will be to transform their customer base, assets and commercial experience into a broader service platform. More than a dispute between supply models, the opening may create room for distributed generation to evolve from a discount on the electricity bill into a relationship and energy management platform. The competitive advantage will lie in combining assets, technology and consumer knowledge to deliver the best possible economic solution.
MANAGER'S LETTER
/>
MARKET PERFORMANCE
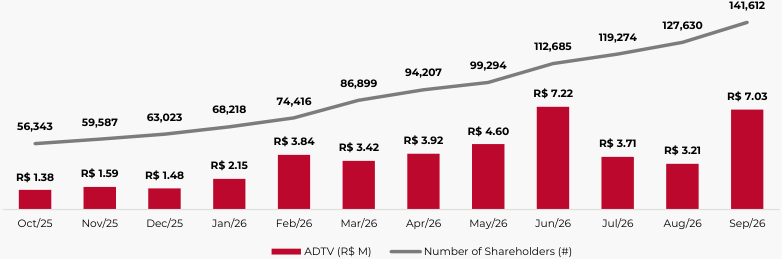
Regarding the September/26 result, the Fund distributed R$ 0.10 per unit, which corresponds to an annualized Dividend Yield of 15.99%, based on the unit's closing price in the reference month. Shareholders holding units in the Fund through September 15, the record date (cum date) for distribution purposes, were entitled to this income. In terms of liquidity, the Fund traded R$ 147,651,101.73 during the month, with a daily average of R$ 7,031,004.84.
MANAGER'S COMMENTS
September brought together three fronts of updates for SNEL11: the formalization of the acquisition of 29 new assets, announced to the market through a Material Fact, the closing of the São Tiago solar plant, and the rise in electricity costs observed in the month's IPCA. Together, they expand the portfolio's scale and geographic diversi�cation and reinforce the attractiveness of distributed generation for the end consumer.
Acquisition of 29 new assets. As per the Material Fact released on September 17, the Fund formalized the acquisition of 29 solar distributed generation real estate projects. The assets total 116.7 MWp of peak power and 84.45 MW of installed capacity, and the total transaction amount is R$ 565,038,033.83. They are located in 10 federative units, as detailed below:
New Assets – Exposure by Utility (MWp)
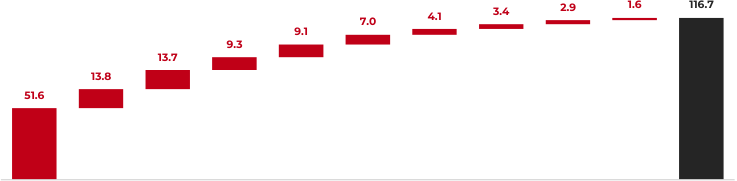



Taken together, the New Assets have a projected real IRR of 16.87% per year, plus energy in�ation, calculated as the weighted average of each asset's acquisition cost. The Manager believes this level is consistent with its allocation discipline in clean energy assets and aligned with the risk-adjusted returns historically pursued by the Fund.
The transaction expands the consolidated portfolio's generation capacity by approximately 215,916 MWh/year. Added to the current portfolio's projection, total generation reaches 464,721 MWh per year. The acquisition also marks the Fund's entry into new utility concession areas: Equatorial Maranhão, Equatorial Piauí, Energisa Paraíba and Enel RJ. This expansion strengthens portfolio diversi�cation and mitigates the climate and operational risks inherent to each utility.
MANAGER'S LETTER
/>
MANAGER'S COMMENTS
| Before (Current Portfolio) | After (Post-Acquisition Portfolio) | Change | |
|---|---|---|---|
| Installed Capacity (MWp) | 149.4 | 266.2 | + 78.1% |
| Installed Capacity (MW) | 110.3 | 194.8 | + 76.6% |
| No. of Projects | 37 | 66 | + 78.4% |
| Federative Units | 11 | 14 | + 3 New States |
| Operational Capacity (MWp) | 142.4 | 259.1 | + 81.9% |
| % of portfolio in operation | 95.3% | 97.4% | +2.05 p.p. |
| Estimated Annual Generation (MWh/Year) | 248,804.5 | 464,721.5 | + 86.8% |
At the closing of the respective transactions, when ownership is transferred to the Fund, 100% of the New Assets will be connected and operational. This characteristic contributes to a balance between generation predictability and the portfolio's appreciation potential.
Portfolio evolution. With the 5th Offering, the portfolio grows from 37 to 66 plants. Installed capacity rises from 149.4 MWp to 266.2 MWp, an increase of 116.7 MWp (+78.1%). P90 generation grows in greater proportion, from 248,805 to 464,721 MWh/year, an addition of 215,916 MWh/year (+86.8%). Generation grows more than capacity because the 5th Offering assets are concentrated in the Northeast, the region with the highest solar irradiation.
In�ation and energy costs. September's IPCA, released by IBGE on October 9, rose 0.82% in the month, above the market expectation of 0.73%. The 12-month cumulative �gure reached 4.58%. Residential electricity rose 7.98% in the month, a move attributed to the end of the Itaipu Bonus, which had been credited on August bills. For SNEL11, rising energy costs are favorable. The savings that distributed generation offers consumers are measured against the distribution utility's tariff. The more expensive grid energy is, the more attractive selfgeneration via DG becomes and, consequently, the greater the value of the Fund's plant capacity.
Closing of the São Tiago solar plant. In September, the Fund completed the closing of the São Tiago solar plant, with 3.5 MWp of capacity. With the closing, ownership of the asset is transferred to SNEL11, and the plant is incorporated into the operating portfolio. The project already has a contracted tenant, NUV, and 37.5% of its commercial ramp-up has been completed. In other words, the plant has been generating revenue for the Fund since its incorporation, and occupancy will continue to advance along the ramp-up until it reaches full capacity.
September marks SNEL11's transition from the fundraising phase to the allocation phase. The proceeds from the 5th Offering are beginning to be converted into operating assets, which changes the Fund's pro�le in terms of scale, geographic diversi�cation and generation potential. The higher energy cost environment reinforces the logic of the thesis: the higher the cost of grid energy, the more relevant distributed generation becomes for the end consumer and the more strategic the Fund's position in this market. In the coming months, the Manager's focus will be on completing the closings, commercializing the incorporated capacity and capturing the results of this expansion.
PORTFOLIO PERFORMANCE
/>

Installed Cap.: 110.4 MWp | No. of Projects: 26 | Operational: 93.7%
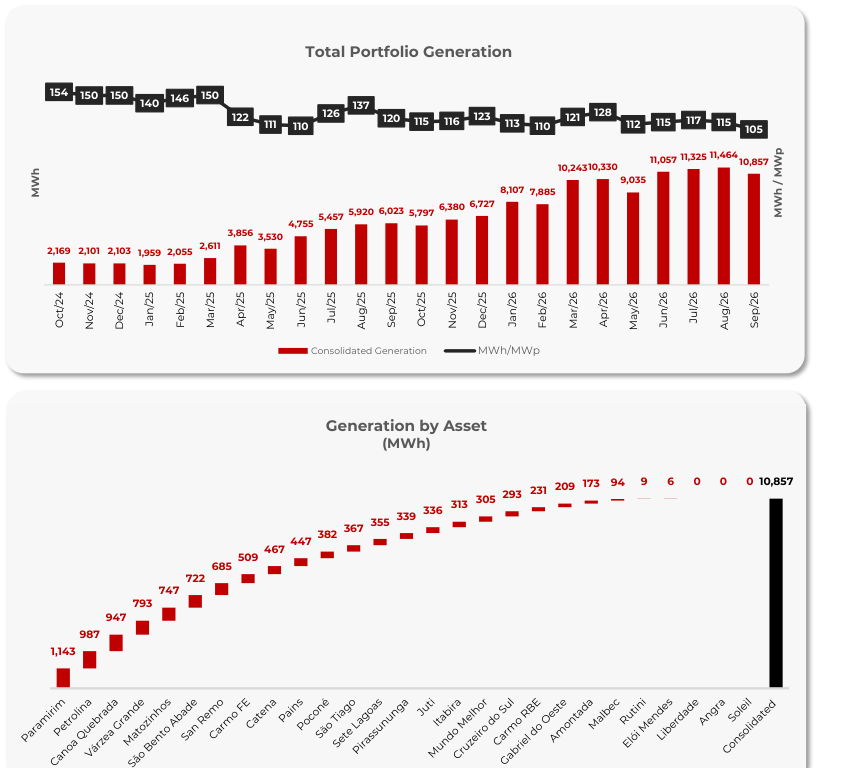
PORTFOLIO SUMMARY
/>
26
Projects in the Portfolio
- 40 assets under acquisition
May/2041
110.4 MWp
Weighted Avg. Maturity
Installed Cap.
- 155.8 MWp of assets under acquisition of the lease agreements
| ASSET PORTFOLIO Identification | Asset Type | SNEL Stake | Vol SNEL (R$ MM) |
|---|---|---|---|
| Assets under Acquisition | PV Plant | 100% | R$ 679.3 |
| Cash & Equivalents | Liquidity | - | R$ 594.4 |
| Projects Holding FII | DG FII | 100% | R$ 244.2 |
| CRI Platão | MBS | - | R$ 41.6 |
| Paramirim | PV Plant | 100% | R$ 33.6 |
| Petrolina 1, 2, 3 & 4 | PV Plant | 100% | R$ 32.8 |
| Matozinhos | PV Plant | 100% | R$ 32.3 |
| San Remo 1 & 2 | PV Plant | 100% | R$ 30.6 |
| Várzea | PV Plant | 100% | R$ 30.3 |
| Canoa Quebrada | PV Plant | 100% | R$ 29.0 |
| Juti | PV Plant | 100% | R$ 18.7 |
| São Tiago | PV Plant | 100% | R$ 17.9 |
| Poconé | PV Plant | 100% | R$ 17.4 |
| São Gabriel do Oeste | PV Plant | 100% | R$ 17.3 |
| Soleil | PV Plant | 100% | R$ 17.0 |
| Cruzeiro do Sul | PV Plant | 100% | R$ 16.7 |
| Itabira | PV Plant | 100% | R$ 14.1 |
| Sete Lagoas | PV Plant | 100% | R$ 12.7 |
| Amontada 2 | PV Plant | 90% | R$ 5.6 |
| CRI Pirelli | MBS | - | R$ 4.0 |
| CRI Fametro | MBS | - | R$ 3.5 |
| Rutini | PV Plant | 100% | R$ 0.5 |
| Elói Mendes | PV Plant | 100% | R$ 0.3 |
| Total | R$ 1,893.7 |
EXPOSURE BY ASSET
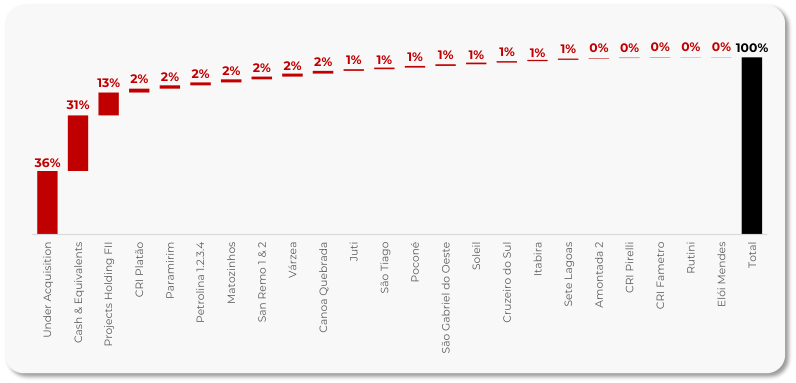
ASSET
/>
DETAILS
Photovoltaic Plant Portfolio — September/2026
| Identification | Utility | Phase | Conn. | MWp | Lease | Tenant | Maturity |
|---|---|---|---|---|---|---|---|
| San Remo 1 | CEMIG-MG | Operating | 06/2024 | 1.40 | Take or Pay | Matrix | 02/2039 |
| San Remo 2 | CEMIG-MG | Operating | 03/2024 | 3.36 | Take or Pay | Matrix | 02/2039 |
| Amontada 2 | ENEL-CE | Operating | 02/2024 | 1.20 | Offset | 9Energia | 01/2039 |
| Petrolina 1 | CELPE-PE | Operating | 06/2024 | 1.26 | Take or Pay | Setta | 12/2035 |
| Petrolina 2 | CELPE-PE | Operating | 06/2024 | 1.26 | Take or Pay | Setta | 06/2035 |
| Petrolina 3 | CELPE-PE | Operating | 06/2024 | 1.26 | Take or Pay | Setta | 12/2035 |
| Petrolina 4 | CELPE-PE | Operating | 06/2024 | 1.26 | Take or Pay | Setta | 06/2035 |
| Itabira | CEMIG-MG | Operating | 09/2023 | 3.06 | Offset | Serena | 08/2030 |
| Liberdade | EQTL-GO | Connection | - | 7.00 | Undefined | Undefined | Undefined |
| Mundo Melhor | EQTL-GO | Operating | 04/2025 | 7.00 | Offset | NUV | 05/2030 |
| São Bento Abade | CEMIG-MG | Operating | 08/2025 | 7.00 | Offset | NUV | 07/2030 |
| Pirassununga | ELEKTRO-SP | Operating | 08/2024 | 3.34 | Take or Pay | Safira | 12/2039 |
| Pains | CEMIG-MG | Operating | 05/2023 | 3.67 | Offset | NUV | 05/2050 |
| Carmo RBE | LIGHT-RJ | Operating | 05/2024 | 5.33 | Offset | NUV | 05/2050 |
| Carmo FE | LIGHT-RJ | Operating | 05/2024 | 5.33 | Offset | NUV | 05/2050 |
| Angra | LIGHT-RJ | Operating | 04/2023 | 4.62 | Offset | NUV | 05/2050 |
| Catena | CEMIG-MG | Operating | 10/2024 | 3.65 | Offset | NUV | 11/2030 |
| Malbec | CEMIG-MG | Operating | 10/2024 | 0.76 | Offset | NUV | 11/2030 |
| Rutini | CEMIG-MG | Operating | 10/2024 | 0.11 | Offset | Juntos | 04/2028 |
| Elói Mendes | CEMIG-MG | Operating | 10/2024 | 0.06 | Offset | Juntos | 04/2029 |
| Paramirim | COELBA-BA | Operating | 08/2025 | 6.72 | Offset | NUV | 01/2030 |
| Cruzeiro do Sul | COPEL-PR | Operating | 04/2025 | 3.37 | Offset | Nextron | 09/2029 |
| Soleil | COPEL-PR | Operating | 10/2024 | 3.37 | Offset | Nextron | 09/2029 |
| Juti | ENERGISA-MS | Operating | 09/2025 | 3.37 | Undefined | Undefined | Undefined |
| Sete Lagoas | CEMIG-MG | Operating | 01/2024 | 2.57 | Undefined | Undefined | Undefined |
| Matozinhos I | CEMIG-MG | Operating | 01/2025 | 3.28 | Offset | Ultra | 07/2029 |
| Matozinhos II | CEMIG-MG | Operating | 01/2025 | 3.28 | Take or Pay | Performa | 06/2038 |
| Várzea 1 | CELPE-PE | Operating | 06/2025 | 3.47 | Undefined | Undefined | Undefined |
| Várzea 2 & 3 | CELPE-PE | Operating | 06/2025 | 2.65 | Take or Pay | Setta | 07/2031 |
| Canoa Quebrada | ENERGISA-MT | Operating | 10/2025 | 6.08 | Undefined | Undefined | Undefined |
| Poconé | ENERGISA-MT | Operating | 08/2025 | 3.45 | Take or Pay | Plin | 12/2036 |
| São Gabriel do Oeste | ENERGISA-MS | Operating | 08/2026 | 3.40 | Undefined | Undefined | Undefined |
| São Tiago | CEMIG-MG | Operating | 12/2025 | 3.50 | Offset | NUV | 12/2035 |
| TOTAL | 110.44 | 05/2041 |
PORTFOLIO SUMMARY
/>
Exposure by Maturity (% MWp)

Exposure by Tenant (% MWp)

Exposure by Lease Type (% MWp)

Exposure by Utility (% MWp)
Geographic Exposure (% MWp)
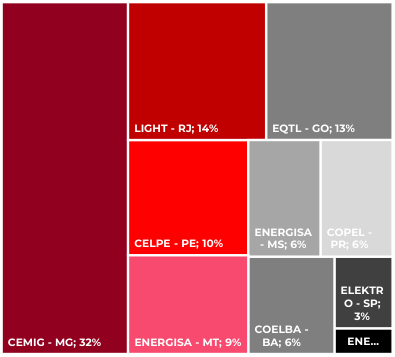
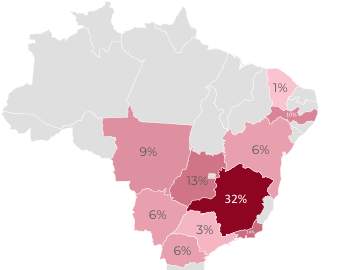

Powe © Microsoft, OpenStreetMap, Overture Maps
PERFORMANCE AND RESULTS
/>
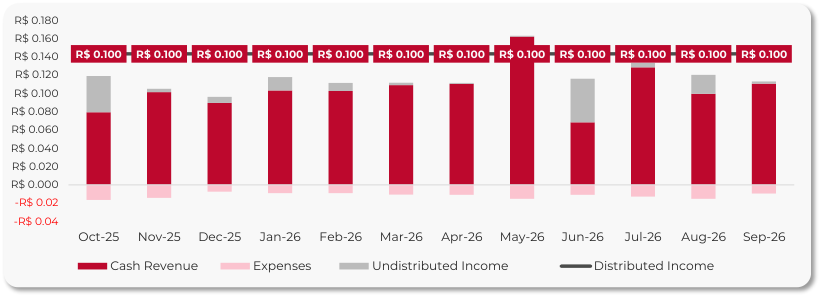
INCOME STATEMENT (R$)
| Jul/26 | Aug/26 | Sep/26 | LTM | 2026 | |
|---|---|---|---|---|---|
| 1. Revenues | 14,219,513 | 11,037,988 | 25,119,579 | 141,497,943 | 122,983,772 |
| 1.a. Lease Revenue (Solar Plants) | 5,940,857 | 10,116,655 | 9,020,093 | 110,621,448 | 92,288,968 |
| 1.b. Cash investments/movements | 8,278,656 | 921,333 | 16,099,486 | 30,876,496 | 30,694,804 |
| 2. Expenses | -1,432,359 | -1,677,643 | -2,146,746 | -14,746,655 | -12,507,720 |
| 2.a. Fund Expenses | -1,239,998 | -1,359,711 | -1,768,580 | -12,709,347 | -10,860,339 |
| 2.b. Non-recurring Expenses | -192,362 | -317,931 | -378,166 | -2,037,308 | -1,647,381 |
| 3. Net Income for the Period (1+2) | 12,787,154 | 9,360,345 | 22,972,833 | 126,751,288 | 110,476,052 |
| 4. Distributable Income | 13,358,164 | 11,644,531 | 23,539,462 | 128,370,463 | 112,090,896 |
| 4.a. Net Income for the Period (3) | 12,787,154 | 9,360,345 | 22,972,833 | 126,751,288 | 110,476,052 |
| 4.b. Undistributed Income* | 571,010 | 2,284,186 | 566,628 | 1,619,175 | 1,614,844 |
| 5. Distributed Income | 11,073,978 | 11,078,205 | 22,703,470 | 127,534,471 | 111,254,904 |
| 5.a. Distribution – SNEL11 | 11,066,007 | 11,066,007 | 22,703,470 | 122,735,298 | 111,235,037 |
| 5.b. Distribution – Receipts | 7,971 | 12,198 | 0 | 4,799,173 | 19,867 |
| 5.c. Distribution R$/unit – SNEL11 Source: QI Tech | 0.10 | 0.10 | 0.10 | 1.20 | 0.90 |
INCOME STATEMENT (R$ / Unit)*
DETAILED MONTHLY RESULT (R$ / Unit)*
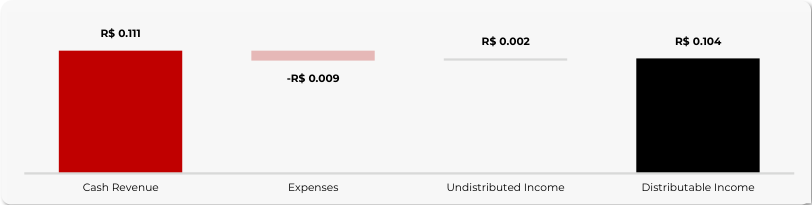
- Excludes receipts arising from the 5th unit offering
PERFORMANCE AND RESULTS
/>
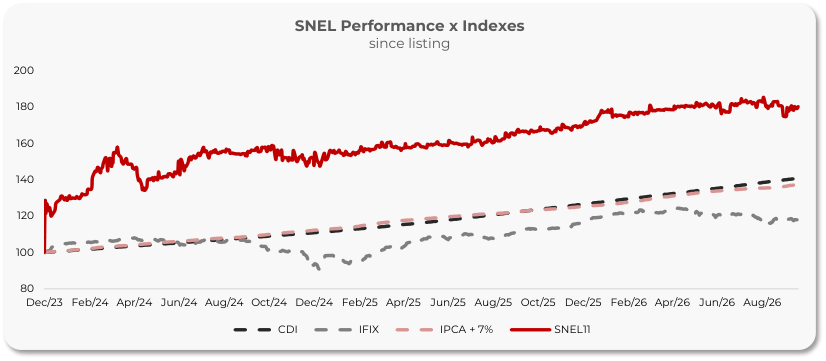
80.15%
/>
37.46%
/>
18.47%
/>
Cum. Return SNEL11 Cum. Return IPCA+7% Cum. Return IFIX Since SNEL11 Listing Since SNEL11 Listing Since SNEL11 Listing
SNEL CUMULATIVE RETURN vs BENCHMARKS SINCE LISTING (Base 100)
AVERAGE DAILY TRADING VOLUME vs NUMBER OF SHAREHOLDERS
ADTV and Number of Shareholders
SUNO ASSET
/>


LEARN MORE
IG SUNO ASSET
YT SUNO ASSET
SNEL11 - SUNO ASSET WEBSITE
FAQ
What is SNEL11?
A Suno Asset real estate fund (FII) focused on developing and acquiring photovoltaic plants (UFVs) under the distributed generation model, producing clean energy and recurring income.
Where does the fund invest?
In distributed generation photovoltaic plants (UFVs), with 66 projects and 266.2 MWp of installed capacity across 14 federative units (BA, MG, GO, PE, RJ, MS, CE, MT, PI, MA, SP, PR, DF and PB).
How does the fund make money?
Through lease agreements for the solar plants under Take or Pay or “offset” structures (variable rent tied to the tenant's bene�t). rent tied to the tenant's benefit).
Are the units liquid?
Yes. Traded daily on B3 (ticker: SNEL11), with average volume of R$ 7.0 million/day in Sep/26 and more than 141 thousand shareholders.
Are the distributions taxed?
For individual investors, distributed income is exempt from income tax under FII legislation. The fund has an FII structure with potential exemption on the projects' revenue.
How do income distributions work?
Monthly payments. In Sep/26, the distribution was R$ 0.10/unit, with an annualized DY of 15.99%. Guidance for the next 3 months: R$ 0.10.
What does P/BV mean?
What is the fund's current strategy?
The fund has evolved from development (green�eld) to acquiring operating solar plants, (greenfield) to acquiring operating solar plants, prioritizing stable results and predictable income.
The ratio between the unit's market price and its book value. Today, the fund trades at 1.01x, a ~1% premium to book value.
What is distributed generation (DG)?
Where can I find reports and official information?
On the Suno Asset website → suno.com.br/asset/fundos/snel11
A system in which plants connected to the local grid generate energy credits for consumers, who pay rent to the fund.
DISCLAIMER
/>
“Investment funds are not guaranteed by the fund administrator, by the portfolio manager, by any insurance mechanism or by the Credit Guarantee Fund – FGC. Past performance is no guarantee of future results. Investors are advised to read the investment fund’s prospectus and bylaws carefully before investing their funds. Investors must be prepared to accept the risks inherent to the various markets in which investment funds operate and, consequently, possible variations in the invested capital. The Administrator is not liable for any errors or omissions in this material, nor for the use of the information contained herein. In addition, the Administrator is not liable for investors’ decisions regarding the subject matter of this material, nor for any act or fact of professionals and specialists consulted by it.
This material does not take into account the speci�c investment objectives, �nancial situation or particular needs of any speci�c recipient, and should not serve as the sole source of information in the investor’s decision-making process. Before deciding, the investor should carry out — preferably with the assistance of a duly quali�ed professional — a thorough assessment of the product and its risks in light of their personal objectives and risk tolerance (Suitability).
Suno Gestora de Recursos Ltda. (“Suno Asset”) is the manager of the fund(s) covered by this material and belongs to the Suno business group (“Suno Group”), which also comprises Suno Research, Suno Índices and Suno Consultoria. Although part of the Suno Group, these companies have segregated and autonomous structures.”