
Outros Relatórios SNEL11 de 31/08/2026
Outros Relatórios do Suno Energias Limpas IS (SNEL11), fundo imobiliário de fundos (FoF), com data de referência em 31/08/2026, com entrega no FundosNet (B3) em 15/09/2026. No pregão de 03/11/2026, a cota do SNEL11 fechou a R$ 7,38, com P/VP de 0,92 (valor patrimonial de R$ 7,99 por cota no informe mensal de setembro de 2026). O último rendimento foi de R$ 0,10 por cota, com pagamento em out/2026, e o dividend yield dos últimos 12 meses é de 14,91% sobre a cotação de 03/11/2026. O patrimônio líquido era de R$ 1,8 bilhão no informe mensal de setembro de 2026. Os indicadores são os mais recentes da base do Kartac, não os do período do documento.
Informações
- CNPJ
- 43.741.171/0001-84
- Tipo
- Relatórios
- Assunto
- Outros Relatórios
- Data de referência
- 31/08/2026
- Data de entrega
- 15/09/2026 21:56
- Versão
- 1
- Situação
- (Ativo)
Conteúdo
A S S E T ENIOU RAS ANNEEEE SAS ENIO ANINTE SACAS o e
M A N A G E M E N T R E P O R T August 2026 E ERRA
August 2026
ANNUALIZED DY
DISTRIBUTION/UNIT
R$ 0.10
NET ASSET VALUE
R$ 1,834.3 MM 37 solar plants – 149.4 MWp
15.54% based on market price
CONTENTS
| Executive Summary · · · · · · · · · · · · · · · | 03 |
|---|---|
| Investment Thesis · · · · · · · · · | 04 |
| Energy Column · · · · · · · · · · · · · · · | 05 |
| Manager's Letter· · · · · · · · · · · · · · ·· · · | 06 |
| Portfolio Performance · · · · | 08 |
| Portfolio Summary· · · · · · · · · · · · | 09 |
| Asset Details · · · · | 11 |
| Performance and Results · · · · | 12 |
| Suno Asset· · · · · · · · · · · · · · · · · · · · · · · · | 14 |
| Disclaimer· · · · · · · · · · · · · · · · · · · · · | 15 |
SNEL11 Management Report — August/2026
EXECUTIVE SUMMARY
/>
Manager Suno Gestora de Recursos LTDA
Performance Fee
20% above (IPCA + 7%)
Administrator QI Corretora de Títulos e Valores Mobiliários S.A. Fund Inception December/2022
Management Fee 1.08% p.a. Administration Fee 0.12% p.a.
MONTHLY HIGHLIGHTS
SNEL11's fifth public share issuance closed with proceeds of R$1.01 billion, through the subscription of 116.4 million shares by 424 investors at R$8.65/share, opening the possibility of expanding installed capacity from ~150 MWp to up to 400 MWp in operational solar plants — a move that consolidates SNEL11 among the largest distributed generation players in Brazil.
Starting in August, Light will begin operationalizing the retroactive collection of the 16.69% tariff adjustment, a move that tends to boost tenant performance and generate a positive one-off for the fund, with a direct impact on increasing variable rent from SNEL11's plants in Rio de Janeiro.
Following the acquisitions announced in the material fact disclosed on 01/29/26, another new project has met the relevant conditions precedent and completed the closing phase, finalizing its integration into the portfolio: São Gabriel do Oeste (3.4 MWp / Energisa-MS).
Dividend Yield (annualized) Net Asset Value 15.54% R$ 1,834.3 MM No. of Projects P/BV 37 1.02 (Incl. assets under acquisition) Installed Capacity Market Value 149.4 MWp R$ 1,857.3 MM (Incl. assets under acquisition) Accumulated Profit per unit Total Return (Month) R$ 0.005 0.24% (Excludes 5th Offering Receipts)
Distribution per unit R$ 0.10 Market/Book Unit Price R$ 8.26/R$ 8.08 Cash and Equivalents R$ 158.5 MM (8.7% of Assets) Number of shareholders 127,630
INVESTMENT THESIS
/>
SNEL11 is a real estate fund (FII) focused on real estate projects tied to clean energy generation, with long-term lease agreements, providing predictability and stability in revenue generation.
Its work ranges from technical analysis and initial assessment of projects, through legal due diligence conducted by specialized third-party law firms, to the ongoing monitoring and operation of the assets.
PROJECT STRUCTURE
INVESTMENT PROCESS

ADVANTAGES OF THE THESIS
ENERGY COLUMN
/>
Opening of the Free Market to Low-Voltage Consumers
The opening of the free energy market to low-voltage consumers marks one of the most important changes in the Brazilian electricity sector in recent decades. Starting in November 2027, low-voltage commercial and industrial consumers will be able to choose their energy supplier. A year later, in November 2028, this option will extend to all other consumers, including residential ones.
In practice, the change means separating two things that have been practically inseparable for decades: physical infrastructure will continue to be regulated and operated by distribution utilities, while the purchase of energy will become a decision made by the consumer.
The government's stated expectation is a 20% to 22% reduction in energy costs for consumers who migrate to the free market. But this figure needs to be interpreted carefully. The reduction does not apply to the entire electricity bill. The consumer will continue paying for use of the distribution network, plus charges and taxes. The savings actually reflected on the bill will therefore be smaller and will depend on each consumer's consumption profile and the commercial terms of each contract.
This distinction becomes even more relevant when comparing the free market to distributed generation.
Today, shared distributed generation models already offer discounts averaging approximately 15% on the total energy bill. These are solutions aimed precisely at low-voltage consumers who want to combine renewable energy with lower bills, without requiring investment in installing panels.
At first glance, the opening of the free market could pose a threat to this model. After all, the consumer will now have a new alternative for seeking savings on their electricity bill. But there is another side to this equation.
The ability to choose one's energy supplier tends to raise consumers' awareness of their own consumption. Once consumers begin comparing offers, prices, and commercial terms, it also becomes more natural for them to consider different forms of generation, contracting, and energy management.
This is where distributed generation may find an opportunity: DG can gain new channels of customer access and new forms of relationship. Competition may no longer occur solely between supply models, but instead through the ability to offer the best energy solution for each consumer profile.
The logic shifts from simply "generating energy on the rooftop" to "offering the consumer a better solution for their energy." This opens space for subscription models, digital platforms, shared generation, storage, smart demand management, and combinations of distributed generation and the free market. There is yet another element that changes the competitive equation of the free market.
Law No. 15,269/2025 ended, for new consumers, one of the main economic advantages that historically drove migration to the free market: the discount on distribution and transmission system usage tariffs associated with incentivized energy. Consumers who already held this benefit retain their rights under the established rules, but new entrants no longer have access to the same advantage.
This places the opening of the low-voltage segment in a very different scenario from the one that marked the expansion of the free market among large consumers. During that period, the combination of competitive energy prices and the discounts associated with incentivized energy could produce quite significant reductions in the final cost of contracting. That same equation will not be available to new consumers.
Competition, therefore, will have to find new paths — and that is precisely where the opening may become more interesting.
Rather than producing a simple price war, the new environment tends to stimulate competition over business models. The low-voltage consumer does not necessarily want to learn to operate in the complex energy market. They want a simple, reliable solution that makes economic sense.
Whoever manages to turn the sector's complexity into a simple experience for the consumer could gain a relevant position in this new market.
This applies to retailers, but also to distributed generation companies, digital platforms, integrators, storage companies, energy managers, and new entrants capable of combining different technologies and energy sources into a single value proposition.
The evolution of the power system itself points in this direction. The growth of distributed solar generation is already creating new challenges for system operation and increasing the need for technologies capable of managing surpluses, storing energy, and balancing supply and demand.
The great transformation, therefore, may not lie solely in the price per kilowatt-hour. It lies in the fact that consumers are beginning to recognize the relevance of the power of choice.
When a market for essential infrastructure moves from a model based on tariffs and predominantly passive relationships to one in which millions of consumers can choose, compare, and switch suppliers, opportunities arise that go far beyond simply selling cheaper energy.
The opening of the free market looks less like the start of a price war and more like the beginning of a new race for technology, platforms, efficiency, and innovation in business models. Distributed generation, the free market, storage, demand management, and digitalization do not necessarily need to be competing models. They can be parts of the same transformation: the shift from a consumer who simply pays their electricity bill to a consumer who chooses, combines, and manages their own energy strategy.
It is in this behavioral shift that the true scale of the transformation now beginning in the Brazilian electricity market may lie.
MANAGER'S LETTER
/>
MARKET PERFORMANCE
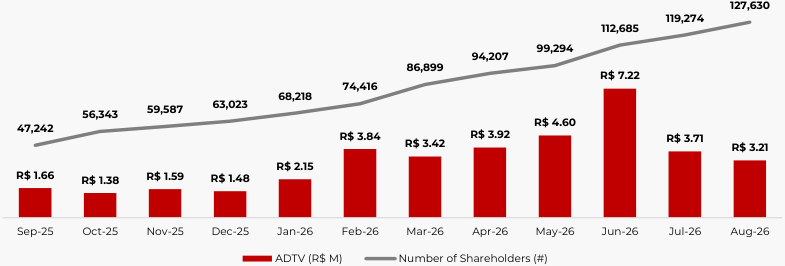
Regarding the August/26 result, the Fund distributed R$ 0.10 per unit, which corresponds to an annualized Dividend Yield of 15.54% based on the unit's closing price in the reference month. Shareholders holding units in the Fund through August 15, the record date (cum date) for distribution purposes, were entitled to this income. In terms of liquidity, the fund traded R$ 67,335,257.67 during the month, with a daily average of R$ 3,206,440.84.
MANAGER'S COMMENTS
August brought together developments across six fronts for SNEL11 — capital, closings, pipeline, regulatory, performance, and income distribution — which, taken together, help explain the maintenance of the income distribution announced for the coming months.
Capitalization and use of proceeds. We concluded, at the end of August, SNEL11's fifth public share issuance, raising R$1.01 billion through the subscription of 116.4 million shares by 424 investors, at a price of R$8.65 per share. The amount enables the expansion of installed capacity from the current ~150 MWp to up to 400 MWp. The proceeds will be allocated to the acquisition of already-operational solar plants, with lease agreements in place and a generation track record, rather than to the construction of new (greenfield) projects. This prioritization reflects the current market reading: capitalizing on the sector's cyclical imbalance to acquire operational assets at a discount, aiming to capture their appreciation amid the growing scarcity of projects under the GD0 and GD1 regimes. Since the capital raise was only concluded at the end of the month, capital allocation is a workstream for the coming months. The pace of expansion from the current ~150 MWp to the projected 400 MWp will depend on the flow of opportunities and the acquisition multiples negotiated by management.
Acquisition closings. Following the acquisitions announced in the material fact disclosed on 01/29/26, one more project met the conditions precedent and completed closing in August: the São Gabriel do Oeste solar plant (UFV), 3.4 MWp, in Mato Grosso do Sul, within Energisa-MS's concession area. The asset now represents 3.2% of the fund's total installed capacity, with projected annual generation of 5,624 MWh. The asset is operational but does not yet have a tenant. The project carries a 6- month RMG (minimum guaranteed revenue) from closing, ensuring cash generation during the commercial ramp-up period. The projected normalized NOI Yield is 16.1%.
Mapped pipeline. This currently comprises 64 distributed photovoltaic generation projects, located in 14 states, corresponding to 230 MWp (170 MWac) of installed capacity and an average projected Real Internal Rate of Return of 17.44% p.a., as shown in the table below :
| Utility (Distributor) | MW | MWp | Projected Annual Generation (MWh) | Average Projected IRR |
|---|---|---|---|---|
| CEMIG | 53.80 | 71.32 | 129,655.00 | 16.66% |
| Neoenergia BA | 33.50 | 46.31 | 88,588.40 | 16.69% |
| Equatorial MA | 25.00 | 33.80 | 66,675.00 | 19.44% |
| Equatorial PA | 12.50 | 16.55 | 32,022.00 | 20.89% |
| Neoenergia PE | 10.70 | 13.72 | 22,865.39 | 16.41% |
| Energisa MT | 7.50 | 9.68 | 19,267.00 | 18.31% |
| Equatorial PI | 6.50 | 9.28 | 18,429.00 | 17.08% |
| Enel RJ | 4.50 | 6.31 | 9,981.00 | 19.23% |
| CPFL Paulista | 2.50 | 5.04 | 6,924.00 | 16.58% |
| Energisa MS | 3.50 | 4.47 | 8,731.00 | 16.94% |
| Enel CE | 3.00 | 4.12 | 7,773.00 | 11.59% |
| Elektro | 2.50 | 3.45 | 6,276.00 | 16.90% |
| Copel PR | 2.00 | 2.61 | 4,086.00 | 16.94% |
| Equatorial CEEE | 1.30 | 1.72 | 2,790.00 | 16.94% |
| Energisa PB | 1.25 | 1.65 | 3,357.00 | 16.14% |
| Total | 170.04 | 230.03 | 427,419.79 | 17.44% |
Of the total above, 100% of the pipeline corresponds to projects that are already built and connected to the grid ("Operational") or that will have becoming Operational as a condition precedent for payment release and deal closing.
MANAGER'S LETTER
/>
MANAGER'S COMMENTS
Regulatory front — the Light/ANEEL case. The litigation between the distribution utility Light and ANEEL centered on the use of PIS/Cofins tax credits in the tariff calculation: Light argued that part of these credits should not be used to reduce tariffs, while ANEEL defended their full pass-through to consumers. The dispute went through judicial decisions and reversals between March and May, a period during which a reduced index of 8.59% was temporarily in effect. The outcome, which took practical effect in August, maintained the average tariff adjustment of 16.69% (21.35% for high voltage and 14.74% for low voltage) — more than double the provisional index. In practice, Light began operationalizing in August the retroactive collection of the tariff difference corresponding to the period in which the lower index was in effect.
For SNEL11, with approximately 14% of its installed capacity in Light's concession area (Rio de Janeiro), the effect manifests in two distinct layers: first, it boosts tenant performance and generates a positive one-off for the fund, directly impacting the increase in variable rent from SNEL11's plants; second, and of greater long-term impact, a structural increase is observed in the region's electricity price and, consequently, in the attractiveness of self-generation via distributed generation. This scenario tends to increase the lease rates charged for these projects.
Income distribution. Considering the set of factors observed during the month — capitalization, the regulatory outcome with a cash impact, portfolio expansion on schedule, and the operational performance of mature assets — we project maintaining the income distribution at R$0.10 per share through December. We reinforce that the distribution is subject to revision at any time, depending on changes in operating, regulatory, or market conditions, and does not constitute a guarantee of future returns.
PORTFOLIO PERFORMANCE
/>

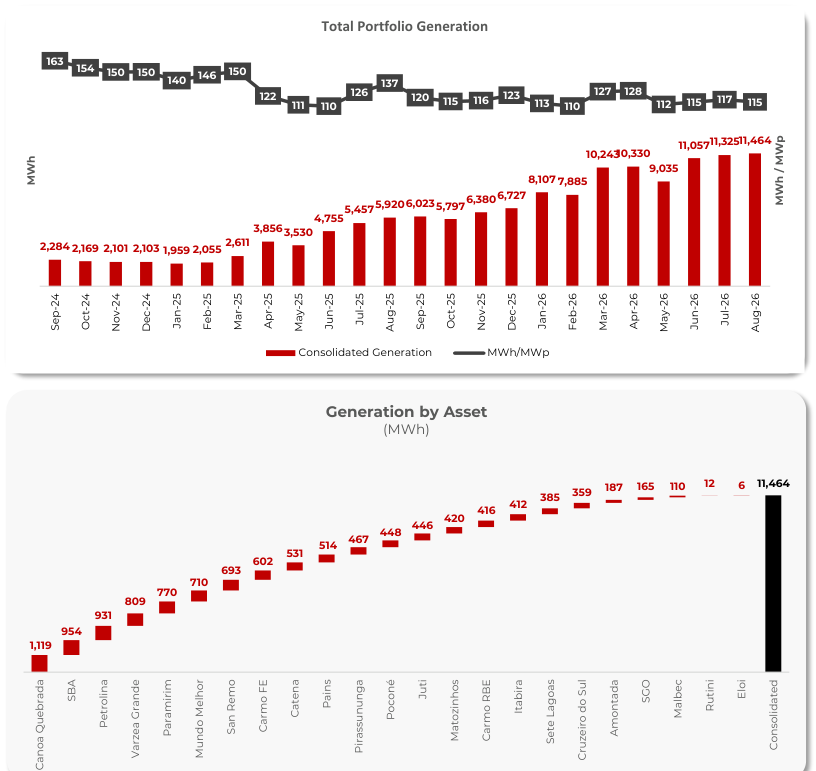
Installed Cap. 106.9 MWp | No. of Projects: 26 | Operational: 93.5%
PORTFOLIO SUMMARY
/>
26
Projects in the Portfolio
- 11 assets under acquisition
Aug/2041
106.9 MWp
Weighted Avg. Maturity
Installed Cap.
- 42.5 MWp of assets under acquisition of the lease agreements
ASSET PORTFOLIO
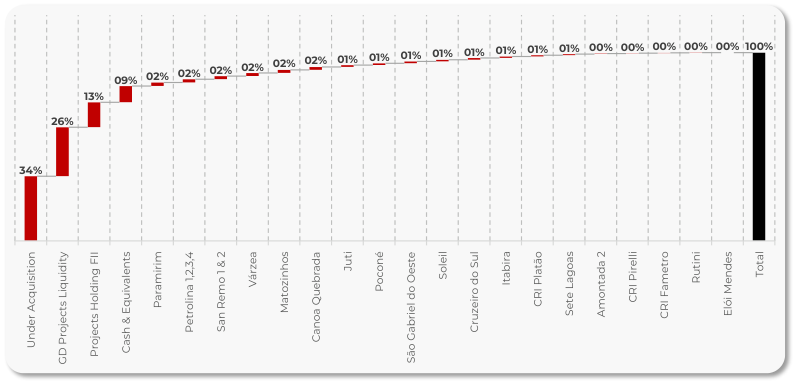
| Identification | Asset Type | SNEL Stake | Vol SNEL (R$ MM) |
|---|---|---|---|
| Assets under Acquisition | PV Plant | 100% | R$ 628.3 |
| GD Projects Liquidity* | REIT | 100% | R$ 476.0 |
| Projects Holding FII ** | REIT | 100% | R$ 241.5 |
| Cash & Equivalents | Cash & Equivalents | - | R$ 158.5 |
| Paramirim | PV Plant | 100% | R$ 33.6 |
| Petrolina 1.2.3.4 | PV Plant | 100% | R$ 32.8 |
| San Remo 1 & 2 | PV Plant | 100% | R$ 30.6 |
| Várzea | PV Plant | 100% | R$ 30.3 |
| Matozinhos | PV Plant | 100% | R$ 29.5 |
| Canoa Quebrada | PV Plant | 100% | R$ 29.0 |
| Juti | PV Plant | 100% | R$ 18.7 |
| Poconé | PV Plant | 100% | R$ 17.4 |
| São Gabriel do Oeste | PV Plant | 100% | R$ 17.3 |
| Soleil | PV Plant | 100% | R$ 17.0 |
| Cruzeiro do Sul | PV Plant | 100% | R$ 16.7 |
| Itabira | PV Plant | 100% | R$ 14.1 |
| CRI Platão | MBS | - | R$ 12.1 |
| Sete Lagoas | PV Plant | 100% | R$ 11.6 |
| Amontada 2 | PV Plant | 90% | R$ 5.6 |
| CRI Pirelli | MBS | - | R$ 3.9 |
| CRI Fametro | MBS | - | R$ 3.6 |
| Rutini | PV Plant | 100% | R$ 0.5 |
| Elói Mendes | PV Plant | 100% | R$0.3 |
| R$ 1,828.9 |
- FII Tactical fund used to earn a return on cash while the proceeds are not yet deployed in the ongoing acquisitions.
** FII Structural fund into which the assets acquired in SNEL's 2nd and 3rd offerings were incorporated, except for Micro DG assets.
EXPOSURE BY ASSET
ASSET DETAILS
/>
Photovoltaic Plant Portfolio — August/2026
| Identification | Utility | Phase | Conn. | MWp | Lease | Tenant | Maturity |
|---|---|---|---|---|---|---|---|
| San Remo 1 | CEMIG-MG | Operating | 06/2024 | 1.40 | Take or Pay | Matrix | 02/2039 |
| San Remo 2 | CEMIG-MG | Operating | 03/2024 | 3.36 | Take or Pay | Matrix | 02/2039 |
| Amontada 2 | ENEL-CE | Operating | 02/2024 | 1.20 | Offset | 9Energia | 01/2039 |
| Petrolina 1 | CELPE-PE | Operating | 06/2024 | 1.26 | Take or Pay | Setta | 12/2035 |
| Petrolina 2 | CELPE-PE | Operating | 06/2024 | 1.26 | Take or Pay | Setta | 06/2035 |
| Petrolina 3 | CELPE-PE | Operating | 06/2024 | 1.26 | Take or Pay | Setta | 12/2035 |
| Petrolina 4 | CELPE-PE | Operating | 06/2024 | 1.26 | Take or Pay | Setta | 06/2035 |
| Itabira | CEMIG-MG | Operating | 09/2023 | 3.06 | Offset | Serena | 08/2030 |
| Liberdade | EQTL-GO | Connect | - | 7.00 | Undefined | Undefined | Undefined |
| Mundo Melhor | EQTL-GO | Operating | 04/2025 | 7.00 | Offset | NUV | 05/2030 |
| São Bento Abade | CEMIG-MG | Operating | 08/2025 | 7.00 | Offset | NUV | 07/2030 |
| Pirassununga | ELEKTRO-SP | Operating | 08/2024 | 3.34 | Take or Pay | Safira | 12/2039 |
| Pains | CEMIG-MG | Operating | 05/2023 | 3.67 | Offset | NUV | 05/2050 |
| Carmo RBE | LIGHT-RJ | Operating | 05/2024 | 5.33 | Offset | NUV | 05/2050 |
| Carmo FE | LIGHT-RJ | Operating | 05/2024 | 5.33 | Offset | NUV | 05/2050 |
| Angra | LIGHT-RJ | Operating | 04/2023 | 4.62 | Offset | NUV | 05/2050 |
| Catena | CEMIG-MG | Operating | 10/2024 | 3.65 | Offset | NUV | 11/2030 |
| Malbec | CEMIG-MG | Operating | 10/2024 | 0.76 | Offset | NUV | 11/2030 |
| Rutini | CEMIG-MG | Operating | 10/2024 | 0.11 | Offset | Juntos | 04/2028 |
| Elói Mendes | CEMIG-MG | Operating | 10/2024 | 0.06 | Offset | Juntos | 04/2029 |
| Paramirim | COELBA-BA | Operating | 08/2025 | 6.72 | Offset | NUV | 01/2030 |
| Cruzeiro do Sul | COPEL-PR | Operating | 04/2025 | 3.37 | Offset | Nextron | 09/2029 |
| Soleil | COPEL-PR | Operating | 10/2024 | 3.37 | Offset | Nextron | 09/2029 |
| Juti | ENERGISA-MS | Operating | 09/2025 | 3.37 | Undefined | Undefined | Undefined |
| Sete Lagoas | CEMIG-MG | Operating | 01/2024 | 2.57 | Undefined | Undefined | Undefined |
| Matozinhos I | CEMIG-MG | Operating | 01/2025 | 3.28 | Offset | Ultra | 07/2029 |
| Matozinhos II | CEMIG-MG | Operating | 01/2025 | 3.28 | Take or Pay | Performa | 06/2038 |
| Várzea 1 | CELPE-PE | Operating | 06/2025 | 3.47 | Undefined | Undefined | Undefined |
| Várzea 2 & 3 | CELPE-PE | Operating | 06/2025 | 2.65 | Take or Pay | Setta | 07/2031 |
| Canoa Quebrada | ENERGISA-MT | Operating | 10/2025 | 6.08 | Undefined | Undefined | Undefined |
| Poconé | ENERGISA-MT | Operating | 10/2025 | 3.45 | Take or Pay | Plin | 12/2036 |
| São Gabriel do Oeste | ENERGISA-MS | Operating | 08/2026 | 3.40 | Undefined | Undefined | Undefined |
| TOTAL | 106.9 | 08/2041 |
PORTFOLIO SUMMARY
/>
Exposure by Maturity (% MWp)

Exposure by Tenant (% MWp)

Exposure by Lease Type (% MWp)

Exposure by Utility (% MWp)
Geographic Exposure (% MWp)
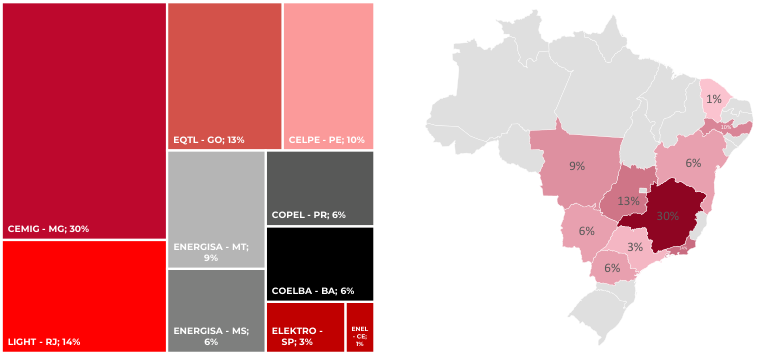
Powered by Bin © Microsoft, OpenStreetMap, Overture Maps Fundatio
PERFORMANCE AND RESULTS
/>
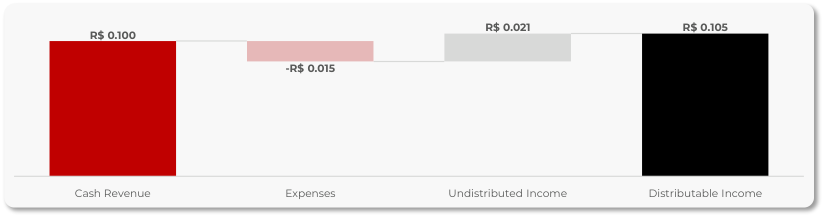
INCOME STATEMENT (R$)
| Jun/26 | Jul/26 | Aug/26 | LTM | 2026 | |
|---|---|---|---|---|---|
| 1. Revenues | 7,562,362 | 14,219,513 | 11,037,988 | 118,189,018 | 97,864,193 |
| 1.a. Lease Revenue (Solar Plants) | 7,129,257 | 5,940,857 | 10,116,655 | 103,384,433 | 83,268,874 |
| 1.b. Cash investments/movements | 433,106 | 8,278,656 | 921,333 | 14,804,585 | 14,595,319 |
| 2. Expenses | -1,201,832 | -1,432,359 | -1,677,643 | -13,219,488 | -10,360,974 |
| 2.a. Fund Expenses | -1,089,235 | -1,239,998 | -1,359,711 | -11,521,656 | -9,091,760 |
| 2.b. Non-recurring Expenses | -112,596 | -192,362 | -317,931 | -1,697,832 | -1,269,215 |
| 3. Net Income for the Period (1+2) | 6,360,531 | 12,787,154 | 9,360,345 | 104,969,530 | 87,503,219 |
| 4. Distributable Income | 11,657,142 | 13,358,164 | 11,644,531 | 109,231,050 | 89,118,063 |
| 4.a. Net Income for the Period (3) | 6,360,531 | 12,787,154 | 9,360,345 | 104,969,530 | 87,503,219 |
| 4.b. Undistributed Income* | 5,296,611 | 571,010 | 2,284,186 | 4,261,520 | 1,614,844 |
| 5. Distributed Income | 11,066,007 | 11,073,978 | 11,078,205 | 108,664,724 | 88,551,737 |
| 5.a. Distribution – SNEL11 | 11,066,007 | 11,066,007 | 11,066,007 | 103,865,248 | 88,531,568 |
| 5.b. Distribution – Receipts | 0 | 7,971 | 12,198 | 4,799,476 | 20,169 |
| 5.c. Distribution R$/unit – SNEL11 S o u r c e : Q I T e c h | 0.10 | 0.10 | 0.10 | 1.20 | 0.80 |
INCOME STATEMENT (R$ / Unit)
SNEL11 Result (R$/share)
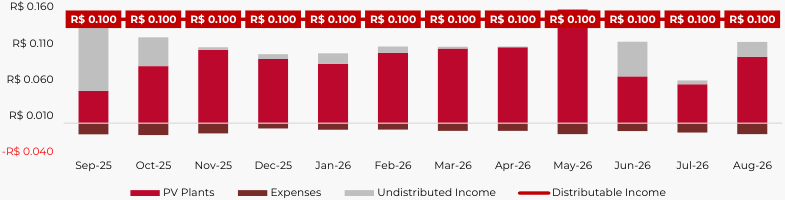
DETAILED MONTHLY RESULT (R$ / Unit)
PERFORMANCE AND RESULTS
/>
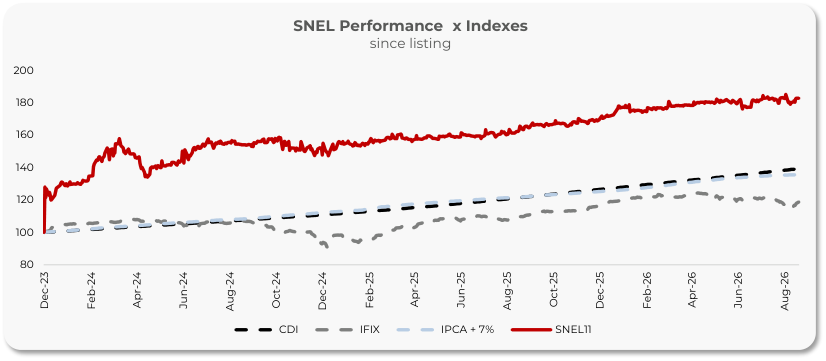
82.80 %
/>
35.63 %
/>
18.71%
/>
Cum. Return SNEL11 Cum. Return IPCA+7% Cum. Return IFIX Since SNEL11 Listing Since SNEL11 Listing Since SNEL11 Listing
SNEL CUMULATIVE RETURN vs BENCHMARKS SINCE LISTING (Base 100)
AVERAGE DAILY TRADING VOLUME vs NUMBER OF SHAREHOLDERS
ADTV and Number of Shareholders
SUNO ASSET
/>


LEARN MORE
~~o~~ IG SUNO ASSET ~~o~~ YT SUNO ASSET SNEL11 - SUNO ASSET WEBSITE ~~O~~
FAQ
What is SNEL11?
A Suno Asset real estate fund (FII) focused on developing and acquiring photovoltaic plants under the distributed generation model, producing clean energy and recurring income.
Where does the fund invest?
In distributed generation photovoltaic plants, with 26 projects and 106.9 MWp of installed capacity across 10 Brazilian states (MG, RJ, GO, PR, PE, BA, SP, CE, MS, MT).
How does the fund make money?
Through lease agreements on the solar plants under Take or Pay or “offset” structures (variable rent tied to the tenant's benefit).
Are the units liquid?
Yes. Traded daily on B3 (ticker: SNEL11), with average volume above R$ 3.2 million/day and more than 127,000 shareholders.
Are the distributions taxed?
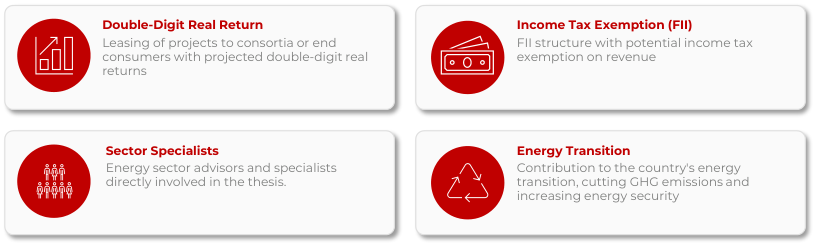
For individual investors, distributed income is exempt from income tax under Brazilian FII legislation. The fund has an FII structure with potential exemption on the projects' revenue.
How are distributions paid?
Monthly payments. In Aug/26, the distribution was R$ 0.10/unit, with an annualized DY of 15.54%. Guidance for the next 3 months: R$ 0.10 to R$ 0.11/unit.
What is the fund's current strategy?
The fund has shifted from greenfield development to acquiring operating solar plants, prioritizing stable results and predictable income.
What does P/BV mean?
The ratio between the unit's market price and its book value. Today the fund trades at 1.02x, a ~2% premium to book value.
Where can I find reports and official information? On the Suno Asset website → suno.com.br/asset/fundos/snel11
What is distributed generation (DG)?
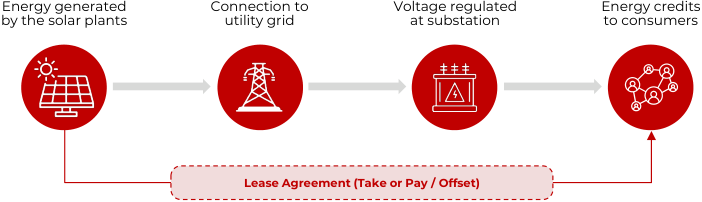
A system in which plants connected to the local grid generate energy credits for consumers, who pay rent to the fund.
DISCLAIMER
/>
“Investment funds are not guaranteed by the fund administrator, by the portfolio manager, by any insurance mechanism or by the Credit Guarantee Fund – FGC. Past performance is no guarantee of future results. Investors are advised to read the investment fund’s prospectus and bylaws carefully before investing their funds. Investors must be prepared to accept the risks inherent to the various markets in which investment funds operate and, consequently, possible variations in the invested capital. The Administrator is not liable for any errors or omissions in this material, nor for the use of the information contained herein. In addition, the Administrator is not liable for investors’ decisions regarding the subject matter of this material, nor for any act or fact of professionals and specialists consulted by it.
This material does not take into account the specific investment objectives, financial situation or particular needs of any specific recipient, and should not serve as the sole source of information in the investor’s decision-making process. Before deciding, the investor should carry out — preferably with the assistance of a duly qualified professional — a thorough assessment of the product and its risks in light of their personal objectives and risk tolerance (Suitability).
Suno Gestora de Recursos Ltda. (“Suno Asset”) is the manager of the fund(s) covered by this material and belongs to the Suno business group (“Suno Group”), which also comprises Suno Research, Suno Índices and Suno Consultoria. Although part of the Suno Group, these companies have segregated and autonomous structures.”