
Outros Relatórios SNEL11 de 31/07/2026
Outros Relatórios do Suno Energias Limpas IS (SNEL11), fundo imobiliário de fundos (FoF), com data de referência em 31/07/2026, com entrega no FundosNet (B3) em 04/09/2026. No pregão de 03/11/2026, a cota do SNEL11 fechou a R$ 7,38, com P/VP de 0,92 (valor patrimonial de R$ 7,99 por cota no informe mensal de setembro de 2026). O último rendimento foi de R$ 0,10 por cota, com pagamento em out/2026, e o dividend yield dos últimos 12 meses é de 14,91% sobre a cotação de 03/11/2026. O patrimônio líquido era de R$ 1,8 bilhão no informe mensal de setembro de 2026. Os indicadores são os mais recentes da base do Kartac, não os do período do documento.
Informações
- CNPJ
- 43.741.171/0001-84
- Tipo
- Relatórios
- Assunto
- Outros Relatórios
- Data de referência
- 31/07/2026
- Data de entrega
- 04/09/2026 18:29
- Versão
- 1
- Situação
- (Ativo)
Conteúdo
A S S E T ENIOU RAS ANNEEEE SAS ENIO ANINTE SACAS o e
M A N A G E M E N T R E P O R T July 2026 E ERRA
July 2026
ANNUALIZED DY
DISTRIBUTION/UNIT
R$ 0.10
NET ASSET VALUE
R$ 929.5 MM 37 solar plants – 149.4 MWp
15.38% based on market price
CONTENTS
| Executive Summary · · · · · · · · · · · · · · · | 03 |
|---|---|
| Investment Thesis · · · · · · · · · | 04 |
| Energy Column · · · · · · · · · · · · · · · | 05 |
| Manager's Letter· · · · · · · · · · · · · · ·· · · | 07 |
| Portfolio Performance · · · · | 08 |
| Portfolio Summary· · · · · · · · · · · · | 09 |
| Asset Details · · · · | 11 |
| Performance and Results · · · · | 12 |
| Suno Asset· · · · · · · · · · · · · · · · · · · · · · · · | 14 |
| Disclaimer· · · · · · · · · · · · · · · · · · · · · | 15 |
SNEL11 Management Report — July/2026
EXECUTIVE SUMMARY
/>
Manager Suno Gestora de Recursos LTDA
Performance Fee
20% above (IPCA + 7%)
Administrator QI Corretora de Títulos e Valores Mobiliários S.A. Fund Inception December/2022
Management Fee 1.08% p.a. Administration Fee 0.12% p.a.
MONTHLY HIGHLIGHTS
The properties acquired in the second and third issuances were reappraised based on a valuation report, resulting in a positive change in the fair value of the assets from R$ 279,260,000 in December 2025 to R$ 310,497,197 in July 2026, equivalent to an 11.2% increase over the period.
Execution of two lease agreements (Take or Pay, 5 years) with Setta Energia for 2.65 MWp (~43.5% of total capacity), with deferral of the first 6 rent payments and cash flow secured by the RMG (Minimum Guaranteed Revenue).
Replacement of Enercooper by Ultra Energia under a 3-year contract (net-metered energy), ensuring immediate demand for the full capacity, active collection on the previous termination, and revenue preservation via the RMG (Minimum Guaranteed Revenue).
Dividend Yield (annualized) Net Asset Value 15.38% R$ 929.5 MM No. of Projects P/BV 37 1.03 (Incl. assets under acquisition) Installed Capacity Market Value 149.4 MWp R$ 959.5 MM (Incl. assets under acquisition) Accumulated Profit per unit Total Return (Month) R$ 0.021 -1.09%
Distribution per unit R$ 0.10 Market/Book Unit Price R$ 8.34/R$ 8.08
Cash and Equivalents R$ 18.24 MM (2.1% of Assets) Number of shareholders
119,274
INVESTMENT THESIS
/>
SNEL11 is a real estate fund (FII) focused on real estate projects tied to clean energy generation, with long-term lease agreements, providing predictability and stability in revenue generation.
Its work ranges from technical analysis and initial assessment of projects, through legal due diligence conducted by specialized third-party law firms, to the ongoing monitoring and operation of the assets.
PROJECT STRUCTURE
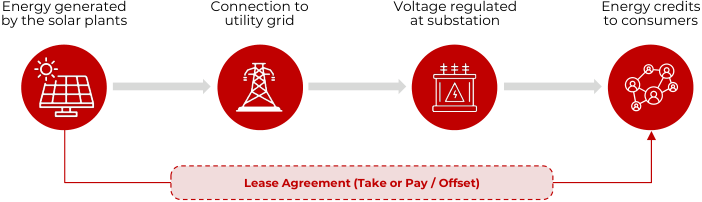
INVESTMENT PROCESS

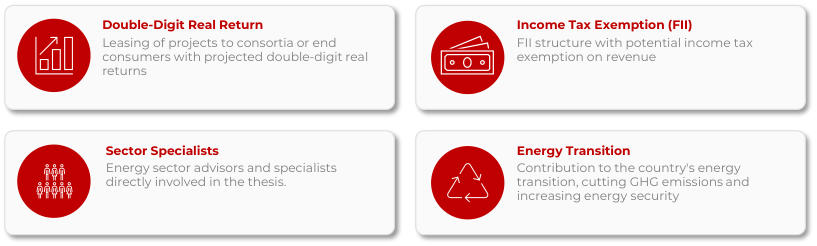
ADVANTAGES OF THE THESIS
ENERGY COLUMN
/>
The Weight of CDE Subsidies and the Impact of Distributed Generation on the Electricity Bill
In recent years, the discussion around the growth of Brazil's Energy Development Account (Conta de Desenvolvimento Energético, CDE) has gained increasing prominence in the debate over the country's electricity sector. With the rapid expansion of distributed generation — particularly solar photovoltaic generation — a narrative took hold that this segment was one of the main drivers behind the rising charges paid by consumers. However, a broader analysis shows that this conclusion is oversimplified and overlooks fundamental aspects of Brazilian energy policy.
The CDE was created to fund a range of public policies in the electricity sector. These include subsidies for social tariffs, discounts for irrigation and aquaculture, universalization of electricity service, subsidies for incentivized sources, isolated systems, domestic coal, and various other government-defined policies. Over the past several years, the CDE's budget has grown consistently, driven mainly by the expansion of these public policies and by the shrinking base of consumers responsible for funding them. Within this context, distributed generation has come to represent a growing share of the CDE for a relatively simple reason.
Because consumers with distributed generation reduce the volume of energy they purchase from the distribution utility, they proportionally reduce their contribution to charges that continue to be collected primarily on billed consumption. This effect increases the relative share borne by remaining consumers in the CDE cost allocation. It is, therefore, a redistribution effect in how the cost of collecting these charges is spread, not necessarily a direct increase in the CDE's overall budget.
It was precisely to address this issue that Law No. 14,300/2022, in Article 17, established the requirement to carry out a methodology for assessing the costs and benefits of distributed generation. The legislator's objective was specifically to prevent regulatory decisions from being made based solely on the costs imposed by distributed generation, without accounting for the gains it provides to the electric power system. At ABSOLAR's request, the consultancy Volt Robotics developed a study to fulfill this legal requirement. The work is based on a fairly simple principle: any technology should be assessed by its net effect on the electric power system, weighing its costs and benefits simultaneously.
Among the benefits identified by the study are: reduction of electrical losses in transmission and distribution; deferral or elimination of grid expansion investments; reduced need to dispatch thermal power plants during various periods; lower exposure to energy market prices; increased energy security; greater resilience of the electric power system; environmental benefits from reduced greenhouse gas emissions; reduced risks associated with centralized generation expansion.
According to the proposed methodology, these benefits carry measurable economic value and offset a significant portion of the costs traditionally attributed to distributed generation. Studies frequently used to criticize distributed generation tend to calculate only the revenue that distribution utilities forgo due to energy compensation (net metering). From that perspective, all energy produced by the consumer represents a financial loss to the system.
The methodology developed by Volt Robotics, by contrast, seeks to answer a different question: how much does the system save because that consumer generates energy close to the point of consumption? These two approaches naturally lead to different results.
If only costs are considered, the conclusion is that distributed generation represents a growing subsidy paid by other consumers. However, when systemic benefits are also factored in, a significant portion of that apparent subsidy is substantially reduced. The goal was to balance incentives for private investment without imposing excessive costs on the broader consumer base. This shift in perspective brings Brazil closer to international best practices, in which energy technologies are evaluated through comprehensive cost-benefit analyses, rather than solely by their immediate impact on utility revenue collection.
From this perspective, distributed generation ceases to be seen merely as a consumer reducing its contribution to system charges, and comes to be recognized instead as an asset that creates value for the entire electric power system by reducing losses, deferring infrastructure investments, enhancing energy security, and contributing to the decarbonization of the power mix. The regulatory challenge is not to decide whether distributed generation generates costs or benefits, but to correctly quantify both, so that the allocation of charges is efficient, transparent, and economically balanced.
MANAGER'S LETTER
/>
MARKET PERFORMANCE
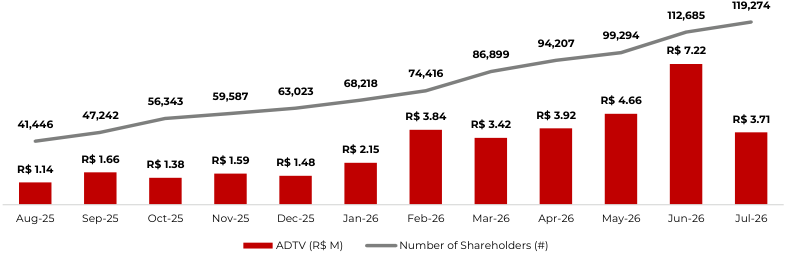
Regarding the July/26 result, the Fund distributed R$ 0.10 per unit, which corresponds to an annualized Dividend Yield of 15.38% based on the unit's closing price in the reference month. Shareholders holding units in the Fund through July 15, the record date (cum date) for distribution purposes, were entitled to this income. In terms of liquidity, the fund traded R$ 85,260,736.29 during the month, with a daily average of R$ 3,706,988.53.
MANAGER'S COMMENTS
In July 2026, SNEL11 maintained the growth trajectory of its investor base, ending the month with 119,274 shareholders, a new all-time high for the Fund. In the same direction, net assets reached R$ 929.5 million and market value reached R$ 959.5 million.
In addition, the fund carried out a revaluation of part of its assets (as shown in the table below). The aggregate impact was an 11.2% increase in project value (2026 vs. 2025), rising from R$ 279.3 million to R$ 310.5 million. The positive highlights were São Bento (+21.0%), Liberdade (+18.5%), and Catena (+13.6%), while Pains (-0.9%) and Pirassununga (-9.7%) were the only plants with a negative revision in the period, reflecting asset-specific performance and assumption differences.
| PV Plants | 2025 | 2026 | Variation |
|---|---|---|---|
| São Bento | R$ 35,620,000 | R$ 43,111,748 | 21.0% |
| Liberdade | R$ 46,770,000 | R$ 55,437,193 | 18.5% |
| Catena | R$ 18,170,000 | R$ 20,643,320 | 13.6% |
| Malbec | R$ 3,770,000 | R$ 4,231,852 | 12.3% |
| Angra | R$ 23,940,000 | R$ 26,831,224 | 12.1% |
| Carmo | R$ 62,520,000 | R$ 69,453,815 | 11.1% |
| Mundo Melhor | R$ 46,500,000 | R$ 50,816,342 | 9.3% |
| Pains | R$ 23,490,000 | R$ 23,279,273 | -0.9% |
| Pirassununga | R$ 18,480,000 | R$ 16,692,430 | -9.7% |
| Total | R$ 279,260,000 | R$ 310,497,197 | 11.2% |
TENANT MOVEMENTS
Várzea 2 and 3: Two lease agreements were executed for part of the solar plants (UFVs) of the Várzea project, recently added to the portfolio. The project has total capacity of 6.1 MWp, of which 2.65 MWp (approximately 43.5%) was the subject of the negotiation. The agreements were signed with Setta Energia on a Take or Pay basis, with a 5-year term and deferral of the first 6 rent payments, which will be settled in equal monthly installments between the 20th and 31st month. Cash flow generation during this period remains secured by the RMG (Minimum Guaranteed Revenue) mechanism established at the time of the asset's acquisition.
Matozinhos 1: The project, previously leased to Enercooper, was reallocated to Ultra Energia. The transaction was carried out through a new 3-year lease agreement (renewable for an equal period), structured under the netmetered energy format and free of default risk from the consortium members. The replacement resulted from Enercooper's termination request, whose outstanding amounts and contractual penalty are already in the collection phase. It is worth noting that Ultra has immediate demand for the plant's full capacity, anticipating a short ramp-up period. The project remains covered by the RMG, ensuring the stability of cash flow generation during the tenant transition.
PORTFOLIO PERFORMANCE
/>

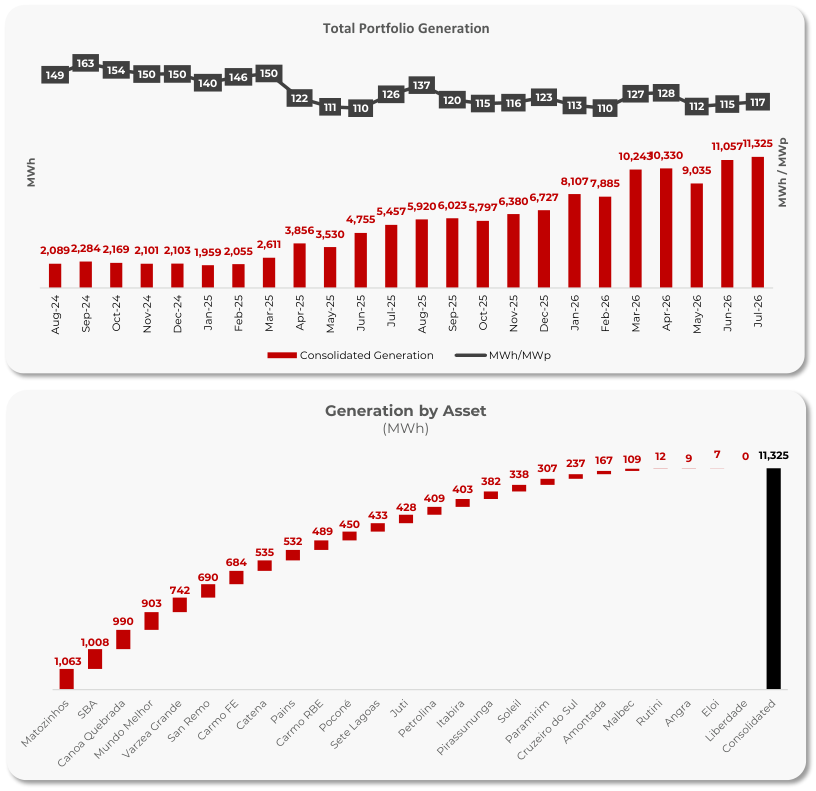
Installed Cap. 103.5 MWp | No. of Projects: 25 | Operational: 93.2%
PORTFOLIO SUMMARY
/>
/>
Projects in the Portfolio
- 12 assets under acquisition
Oct/2036
103.5 MWp
Weighted Avg. Maturity
Installed Cap.
- 45.9 MWp of assets under acquisition of the lease agreements
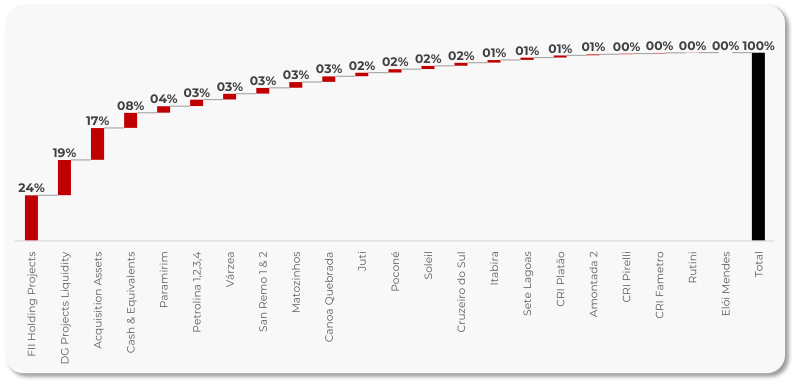
ASSET PORTFOLIO
| Identification | Asset Type | SNEL Stake | Vol SNEL (R$ MM) |
|---|---|---|---|
| REIT Holding Projects | REIT | 100% | R$ 231.0 |
| Project Liquidity DG | REIT | 100% | R$ 179.9 |
| Assets under Acquisitions | PV Plant | 100% | R$ 162.1 |
| Cash and Equivalents | Liquidity | - | R$ 77.1 |
| Paramirim | PV Plant | 100% | R$ 33.6 |
| Petrolina 1,2,3,4 | PV Plant | 100% | R$ 32.8 |
| Várzea | PV Plant | 100% | R$ 30.2 |
| San Remo 1 & 2 | PV Plant | 100% | R$ 29.8 |
| Matozinhos | PV Plant | 100% | R$ 29.5 |
| Canoa Quebrada | PV Plant | 100% | R$ 28.9 |
| Juti | PV Plant | 100% | R$ 18.7 |
| Poconé | PV Plant | 100% | R$ 17.4 |
| Soleil | PV Plant | 100% | R$ 17.0 |
| Cruzeiro do Sul | PV Plant | 100% | R$ 16.0 |
| Itabira | PV Plant | 100% | R$ 14.1 |
| Sete Lagoas | PV Plant | 100% | R$ 11.6 |
| CRI Platão | MBS | - | R$ 11.4 |
| Amontada 2 | PV Plant | 90% | R$ 5.6 |
| CRI Pirelli | MBS | - | R$ 3.9 |
| CRI Fametro | MBS | - | R$ 3.6 |
| Rutini | PV Plant | 100% | R$ 0.5 |
| Elói Mendes | PV Plant | 100% | R$0.3 |
| R$ 954.9 |
- FII Tactical fund used to earn a return on cash while the proceeds are not yet deployed in the ongoing acquisitions.
** FII Structural fund into which the assets acquired in SNEL's 2nd and 3rd offerings were incorporated, except for Micro DG assets.
EXPOSURE BY ASSET
PORTFOLIO SUMMARY
/>
Exposure by Maturity (% MWp)

Exposure by Tenant (% MWp)
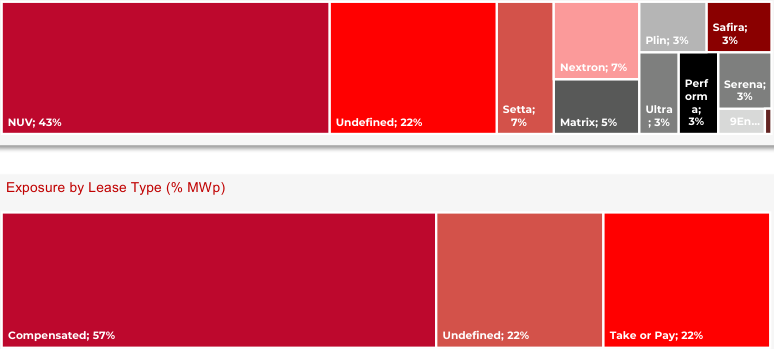
Exposure by Utility (% MWp)
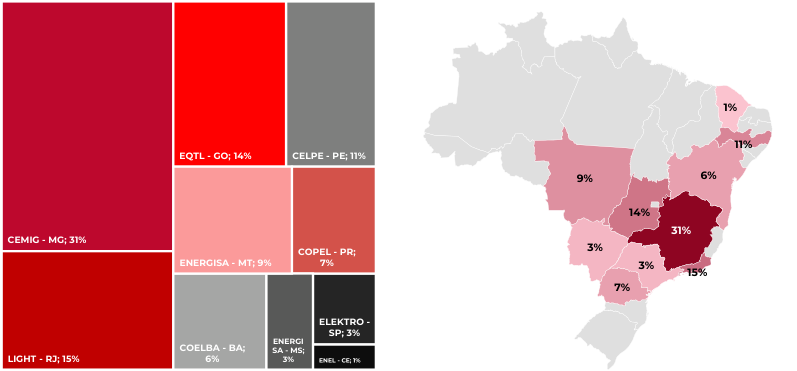
Geographic Exposure (% MWp)
/>
ASSET DETAILS
/>
Photovoltaic Plant Portfolio — July/2026
| Identification | Utility | Phase | Conn. | MWp | Lease | Tenant | Maturity |
|---|---|---|---|---|---|---|---|
| San Remo 1 | CEMIG-MG | Operating | 06/2024 | 1.40 | Take or Pay | Matrix | 02/2039 |
| San Remo 2 | CEMIG-MG | Operating | 03/2024 | 3.36 | Take or Pay | Matrix | 02/2039 |
| Amontada 2 | ENEL-CE | Operating | 02/2024 | 1.20 | Offset | 9Energia | 01/2039 |
| Petrolina 1 | CELPE-PE | Operating | 06/2024 | 1.26 | Take or Pay | Setta | 12/2035 |
| Petrolina 2 | CELPE-PE | Operating | 06/2024 | 1.26 | Take or Pay | Setta | 06/2035 |
| Petrolina 3 | CELPE-PE | Operating | 06/2024 | 1.26 | Take or Pay | Setta | 12/2035 |
| Petrolina 4 | CELPE-PE | Operating | 06/2024 | 1.26 | Take or Pay | Setta | 06/2035 |
| Itabira 1 | CEMIG-MG | Operating | 09/2023 | 3.06 | Offset | Serena | 08/2030 |
| Liberdade | EQTL-GO | Connect. | - | 7.00 | Undefined | Undefined | Undefined |
| Mundo Melhor | EQTL-GO | Operating | 04/2025 | 7.00 | Offset | NUV | 05/2030 |
| São Bento Abade | CEMIG-MG | Operating | 08/2025 | 7.00 | Offset | NUV | 07/2030 |
| Pirassununga | ELEKTRO-SP | Operating | 08/2024 | 3.34 | Take or Pay | Safira | 12/2039 |
| Pains | CEMIG-MG | Operating | 05/2023 | 3.67 | Offset | NUV | 05/2050 |
| Carmo RBE | LIGHT-RJ | Operating | 05/2024 | 5.33 | Offset | NUV | 05/2050 |
| Carmo FE | LIGHT-RJ | Operating | 05/2024 | 5.33 | Offset | NUV | 05/2050 |
| Angra | LIGHT-RJ | Operating | 04/2023 | 4.62 | Offset | NUV | 05/2050 |
| Catena | CEMIG-MG | Operating | 10/2024 | 3.65 | Offset | NUV | 11/2030 |
| Malbec | CEMIG-MG | Operating | 10/2024 | 0.76 | Offset | NUV | 11/2030 |
| Rutini | CEMIG-MG | Operating | 10/2024 | 0.11 | Offset | Juntos | 04/2028 |
| Elói Mendes | CEMIG-MG | Operating | 10/2024 | 0.06 | Offset | Juntos | 04/2029 |
| Paramirim | COELBA-BA | Operating | 08/2025 | 6.72 | Offset | NUV | 01/2030 |
| Cruzeiro do Sul | COPEL-PR | Operating | 04/2025 | 3.37 | Offset | Nextron | 09/2029 |
| Soleil | COPEL-PR | Operating | 10/2024 | 3.37 | Offset | Nextron | 09/2029 |
| Juti | ENERGISA-MS | Operating | 09/2025 | 3.37 | Undefined | Undefined | Undefined |
| Sete Lagoas | CEMIG-MG | Operating | 01/2024 | 2.57 | Undefined | Undefined | Undefined |
| Matozinhos I | CEMIG-MG | Operating | 01/2025 | 3.28 | Offset | Ultra | 07/2029 |
| Matozinhos II | CEMIG-MG | Operating | 01/2025 | 3.28 | Take or Pay | Performa | 06/2038 |
| Várzea 1 | CELPE-PE | Operating | 06/2025 | 3.47 | Undefined | Undefined | Undefined |
| Várzea 2 and 3 | CELPE-PE | Operating | 06/2025 | 2.65 | Take or Pay | Setta | 07/2031 |
| Canoa Quebrada | ENERGISA-MT | Operating | 10/2025 | 6.08 | Undefined | Undefined | Undefined |
| Poconé | ENERGISA-MT | Operating | 10/2025 | 3.45 | Take or Pay | Plin | 12/2036 |
| TOTAL | 103.5 | Oct/2036 |
PERFORMANCE AND RESULTS
/>
INCOME STATEMENT (R$)
| May/26 | Jun/26 | Jul/26 | LTM | 2026 | |
|---|---|---|---|---|---|
| 1. Revenues | 17,958,021 | 7,562,362 | 14,219,513 | 109,018,545 | 86,826,205 |
| 1.a. Lease Revenue (Solar Plants) | 17,337,443 | 7,129,257 | 5,940,857 | 95,114,333 | 73,152,220 |
| 1.b. Cash investments/movements | 620,578 | 433,106 | 8,278,656 | 13,904,212 | 13,673,985 |
| 2. Expenses | -1,676,812 | -1,201,832 | -1,432,359 | -12,412,022 | -8,683,332 |
| 2.a. Fund Expenses | -1,276,369 | -1,089,235 | -1,239,998 | -11,017,676 | -7,732,048 |
| 2.b. Non-recurring Expenses | -400,443 | -112,596 | -192,362 | -1,394,346 | -951,283 |
| 3. Net Income for the Period (1+2) | 16,281,209 | 6,360,531 | 12,787,154 | 96,606,523 | 78,142,873 |
| 4. Distributable Income | 16,362,618 | 11,657,142 | 13,358,164 | 103,704,125 | 79,757,718 |
| 4.a. Net Income for the Period (3) | 16,281,209 | 6,360,531 | 12,787,154 | 96,606,523 | 78,142,873 |
| 4.b. Undistributed Income* | 81,409 | 5,296,611 | 571,010 | 7,097,603 | 1,614,844 |
| 5. Distributed Income | 11,066,007 | 11,066,007 | 11,073,978 | 101,419,939 | 77,473,532 |
| 5.a. Distribution – SNEL11 | 11,066,007 | 11,066,007 | 11,066,007 | 96,632,662 | 77,465,561 |
| 5.b. Distribution – Receipts | 0 | 0 | 7,971 | 4,787,278 | 7,971 |
| 5.c. Distribution R$/unit – SNEL11 | 0.10 | 0.10 | 0.10 | 1.20 | 0.70 |
S o u r c e : Q I T e c h
INCOME STATEMENT (R$ / Unit)
SNEL11 Result (R$/unit)
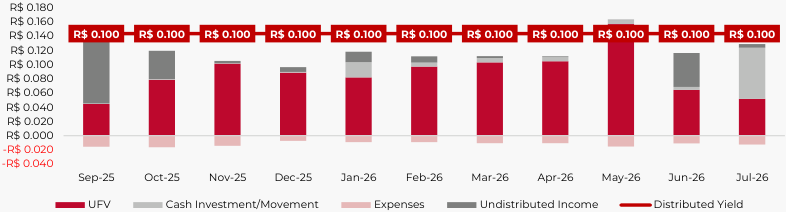
DETAILED MONTHLY RESULT (R$ / Unit)
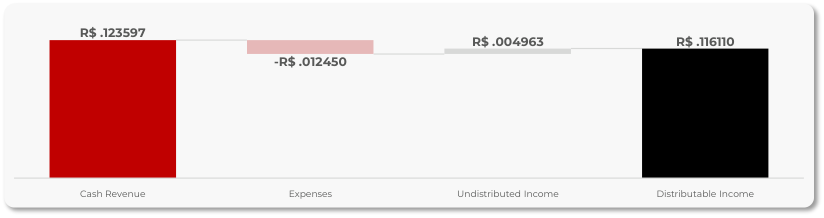
PERFORMANCE AND RESULTS
/>
/>
/>
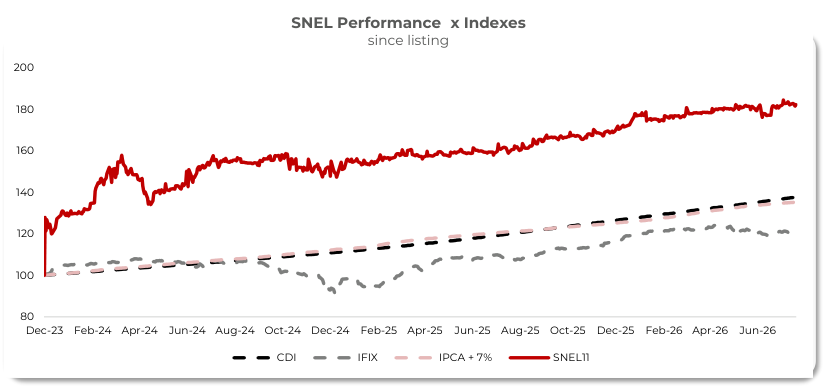
82.39 % 35.32 % 20.47% Cum. Return SNEL11 Cum. Return IPCA+7% Cum. Return IFIX Since SNEL11 Listing Since SNEL11 Listing Since SNEL11 Listing
AVERAGE DAILY TRADING VOLUME vs NUMBER OF SHAREHOLDERS
ADTV and Number of Shareholders
SUNO ASSET
/>

LEARN MORE
~~o~~ IG SUNO ASSET
o ~~o~~ YT SUNO ASSET SNEL11 - SUNO ASSET WEBSITE11 - SUNO ASSET WEBSITE- SUNO ASSET WEBSITE SUNO ASSET WEBSITE ~~O~~
SNEL11 - SUNO ASSET WEBSITE11 - SUNO ASSET WEBSITE- SUNO ASSET WEBSITE SUNO ASSET WEBSITE
FAQ
What is SNEL11?
A Suno Asset real estate fund (FII) focused on developing and acquiring photovoltaic plants under the distributed generation model, producing clean energy and recurring income.
Where does the fund invest?
In distributed generation photovoltaic plants, with 25 projects and 103.5 MWp of installed capacity across 10 Brazilian states (MG, RJ, GO, PR, PE, BA, SP, CE, MS, MT).
How does the fund make money?
Through lease agreements on the solar plants under Take or Pay or “offset” structures (variable rent tied to the tenant's benefit).
Are the units liquid?
Yes. Traded daily on B3 (ticker: SNEL11), with average volume above R$ 3.7 million/day and more than 119,000 shareholders.
Are the distributions taxed?
For individual investors, distributed income is exempt from income tax under Brazilian FII legislation. The fund has an FII structure with potential exemption on the projects' revenue.
How are distributions paid?
Monthly payments. In Jul/26, the distribution was R$ 0.10/unit, with an annualized DY of 15.38%. Guidance for the next 3 months: R$ 0.10 to R$ 0.11/unit.
What is the fund's current strategy?
The fund has shifted from greenfield development to acquiring operating solar plants, prioritizing stable results and predictable income.
What does P/BV mean?
The ratio between the unit's market price and its book value. Today the fund trades at 1.03x, a ~3% premium to book value.
Where can I find reports and official information? On the Suno Asset website → suno.com.br/asset/fundos/snel11
What is distributed generation (DG)?
A system in which plants connected to the local grid generate energy credits for consumers, who pay rent to the fund.
DISCLAIMER
/>
“Investment funds are not guaranteed by the fund administrator, by the portfolio manager, by any insurance mechanism or by the Credit Guarantee Fund – FGC. Past performance is no guarantee of future results. Investors are advised to read the investment fund’s prospectus and bylaws carefully before investing their funds. Investors must be prepared to accept the risks inherent to the various markets in which investment funds operate and, consequently, possible variations in the invested capital. The Administrator is not liable for any errors or omissions in this material, nor for the use of the information contained herein. In addition, the Administrator is not liable for investors’ decisions regarding the subject matter of this material, nor for any act or fact of professionals and specialists consulted by it.
This material does not take into account the specific investment objectives, financial situation or particular needs of any specific recipient, and should not serve as the sole source of information in the investor’s decision-making process. Before deciding, the investor should carry out — preferably with the assistance of a duly qualified professional — a thorough assessment of the product and its risks in light of their personal objectives and risk tolerance (Suitability).
Suno Gestora de Recursos Ltda. (“Suno Asset”) is the manager of the fund(s) covered by this material and belongs to the Suno business group (“Suno Group”), which also comprises Suno Research, Suno Índices and Suno Consultoria. Although part of the Suno Group, these companies have segregated and autonomous structures.”