
Outros Relatórios SNEL11 de 30/06/2026
Outros Relatórios do Suno Energias Limpas IS (SNEL11), fundo imobiliário de fundos (FoF), com data de referência em 30/06/2026, com entrega no FundosNet (B3) em 04/08/2026. No pregão de 03/11/2026, a cota do SNEL11 fechou a R$ 7,38, com P/VP de 0,92 (valor patrimonial de R$ 7,99 por cota no informe mensal de setembro de 2026). O último rendimento foi de R$ 0,10 por cota, com pagamento em out/2026, e o dividend yield dos últimos 12 meses é de 14,91% sobre a cotação de 03/11/2026. O patrimônio líquido era de R$ 1,8 bilhão no informe mensal de setembro de 2026. Os indicadores são os mais recentes da base do Kartac, não os do período do documento.
Informações
- CNPJ
- 43.741.171/0001-84
- Tipo
- Relatórios
- Assunto
- Outros Relatórios
- Data de referência
- 30/06/2026
- Data de entrega
- 04/08/2026 16:01
- Versão
- 1
- Situação
- (Ativo)
Conteúdo
A S S E T
/>
/>
M A N A G E M E N T R E P O R T June 2026
ANNUALIZED DY
DISTRIBUTION/UNIT
R$ 0.10
NET ASSET VALUE
R$ 888.6 MM
37 solar plants – 149.3 MWp
15.4% based on market price
CONTENTS
| Executive Summary · · · · · · · · · · · · · · · | 03 |
|---|---|
| Investment Thesis · · · · · · · · · | 04 |
| Energy Column · · · · · · · · · · · · · · · | 05 |
| Manager's Letter· · · · · · · · · · · · · · ·· · · | 06 |
| Portfolio Performance · · · · | 07 |
| Portfolio Summary· · · · · · · · · · · · | 08 |
| Asset Details · · · · | 10 |
| Performance and Results · · · · | 11 |
| Suno Asset· · · · · · · · · · · · · · · · · · · · · · · · | 13 |
| Disclaimer· · · · · · · · · · · · · · · · · · · · · | 14 |
SNEL11 Management Report — June/2026
EXECUTIVE SUMMARY
/>
Manager Suno Gestora de Recursos LTDA
Performance Fee
20% above (IPCA + 7%)
Administrator QI Corretora de Títulos e Valores Mobiliários S.A. Fund Inception December/2022
Management Fee 1.08% p.a. Administration Fee 0.12% p.a.
MONTHLY HIGHLIGHTS
On June 16, we launched the 5th offering of SNEL11 shares (see the document here). The offering provides for the raising of up to R$1.8 billion, an amount that could reach R$2.3 billion should we decide to exercise the additional 25% lot. The price set for each new share was R$8.65.
Copel implemented a tariff adjustment in its concession area, representing a combined adjustment (TUSD + TE) of approximately 19.6%. The plants in SNEL11's portfolio connected to Copel as the distributor account for 4.5% of the Fund's total installed capacity.
In the same month, SNEL11 completed the process of hiring a specialized company for O&M services for 6 plants in the portfolio — UFV Carmo I, Carmo II, Angra, Pains, Paramirim, and Pirassununga —, with an expected term of 12 months. As a result of the competitive process, the listed plants recorded a 22.52% reduction in O&M costs, evidencing the economic efficiency gain provided by the structured conduct of the contracting process.
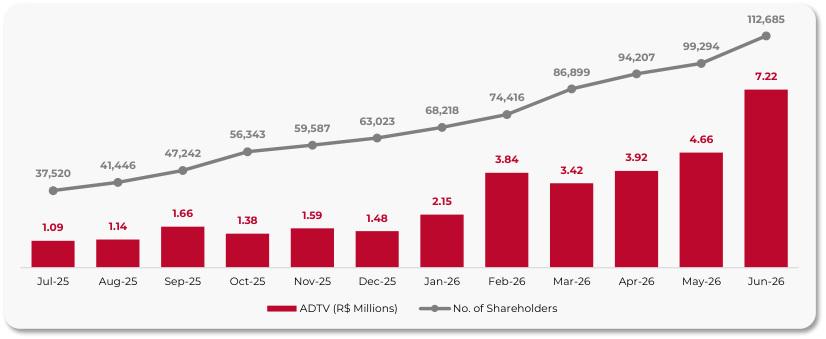
It is also worth highlighting that, in June, SNEL11 surpassed the mark of 110,000 shareholders, in addition to having recorded the highest average daily liquidity in the fund's history, exceeding R$7 million.
Dividend Yield (annualized) Net Asset Value 15.38% R$ 888.6 MM No. of Projects P/BV 37 1.04
Distribution per unit R$ 0.10 Market/Book Unit Price R$ 8.34/R$ 8.03
(Incl. assets under acquisition)
Installed Capacity Market Value 149.4 MWp R$ 922.9 MM (Incl. assets under acquisition) Accumulated Profit per unit Total Return (Month) R$ 0.005 -3.04%
Cash and Equivalents R$ 24.24 MM
(2.66% of Assets)
Number of shareholders
112,685
INVESTMENT THESIS
/>
SNEL11 is a real estate fund (FII) focused on real estate projects tied to clean energy generation, with long-term lease agreements, providing predictability and stability in revenue generation.
Its work ranges from technical analysis and initial assessment of projects, through legal due diligence conducted by specialized third-party law firms, to the ongoing monitoring and operation of the assets.
PROJECT STRUCTURE
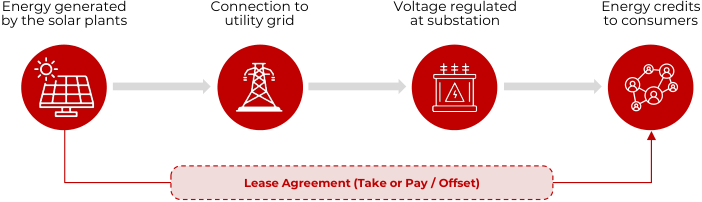
INVESTMENT PROCESS

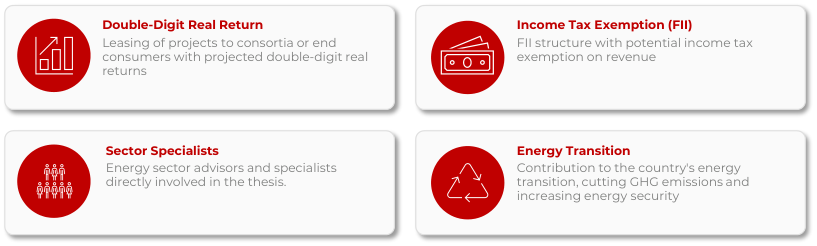
ADVANTAGES OF THE THESIS
ENERGY COLUMN
/>
PUMPED-STORAGE HYDROPOWER PLANTS
Pumped-storage hydropower plants work like a giant water battery. They consist of two reservoirs, an upper and a lower one, connected by tunnels or penstocks housing sets of reversible pump-turbines.
The operating principle is simple. When there is surplus power in the system, as happens in periods of high solar and wind generation, the plant uses that electricity to pump water from the lower reservoir to the upper one, storing energy as gravitational potential. Later, when demand rises or renewable generation falls, the water is released back to the lower reservoir, passes through the turbines and generates electricity, exactly as in a conventional hydro plant.
Unlike electrochemical batteries, this "hydraulic battery" suffers virtually no degradation from charge and discharge cycles. Pumped-storage plants can operate for more than 50 years while keeping efficiency practically stable, with a round-trip efficiency of 70% to 85% in converting the energy used for pumping into electricity later returned to the grid.
In recent years, intermittent renewable sources, especially solar and wind, have gained ground in the power mix thanks to their fast deployment and the possibility of installation at different scales. However, their variable nature creates a new challenge. At certain moments there is surplus energy; at others, it may fall short.
In this context, energy security no longer means simply having enough installed capacity. Today it also means having the flexibility to store energy when it is available and return it to the system at times of peak demand, keeping grid frequency and voltage stable. This is precisely where pumped-storage hydropower plants stand out. They currently account for more than 90% of the world's long-duration energy storage capacity, far surpassing any technology based on electrochemical batteries. In the power sector, the trend is to see the two solutions as complementary. Lithium-ion batteries are better suited to short-duration needs, while pumped storage offers large-scale, long-duration storage.
Brazil has particularly favorable conditions to enter this segment. The country holds 109.8 GW of installed hydropower capacity, one of the largest in the world, along with decades of experience in dam, reservoir and turbine engineering. Even so, it still has no pumped-storage hydropower plant in commercial operation.
This lag is striking. Although it accounts for around 8% of the world's hydropower capacity, Brazil remains outside the group of countries that together operate roughly 175 GW of pumped-storage plants.
Currently, the main obstacle is not technological but regulatory. The subject is part of Aneel's Regulatory Agenda, but definitions are still missing on access to transmission and distribution grids, concession rules and remuneration mechanisms for these projects.
Industry bodies, such as Abrage, argue that the country could already move ahead with a specific regulatory framework for semi-open-loop pumped-storage plants that use existing reservoirs. Such a measure would unlock enormous investment potential in the short term. Industry estimates indicate that Brazil will need to add between 30 and 40 GW of storage capacity over the coming decades to ensure the security of the power system during the energy transition. In this scenario, pumped-storage hydropower plants cease to be merely a technological alternative and become one of the pillars of Brazil's future energy infrastructure.
MANAGER'S LETTER
/>
MARKET PERFORMANCE
Regarding the June/26 result, the Fund distributed R$ 0.10 per unit, which corresponds to an annualized Dividend Yield of 15.4% based on the unit's closing price in the reference month. Shareholders holding units in the Fund through June 15, the record date (cum date) for distribution purposes, were entitled to this income. In terms of liquidity, the fund traded R$ 151,565,150.33 during the month, with a daily average of R$ 7,217,388.11.
MANAGER'S COMMENTS
June 2026 was a month of institutional consolidation and structural progress for SNEL11, marked by complementary fronts: confirmation of the operational efficiency gains pursued over the previous quarter, and the expansion of the Fund's investor base.
Among the operational advances, the completion of the O&M service contracting process for six plants in the portfolio stands out — UFV Carmo I, Carmo II, Angra, Pains, Paramirim, and Pirassununga. Conducted through a competitive RFP, the process resulted in the hiring of a company responsible for SCADA-based operation, preventive and corrective maintenance, technical-regulatory administration, and CCTV and connectivity management, with a twelve-month term subject to renewal. The practical result of this structured process was a 22.52% reduction in O&M costs for the plants listed.
This discipline in governance and cost efficiency takes on added relevance in light of the month's tariff environment: in June, Copel carried out a tariff adjustment in its concession area, with the TUSD tariff rising from R$366.67 to R$457.17 (+24.7%) and the TE rising from R$275.75 to R$310.85 (+12.7%) — a combined adjustment of approximately 19.6%. The portfolio plants connected to Copel as the distributor account for 4.5% of the Fund's total installed capacity.
It is also worth highlighting that, in June, SNEL11 surpassed the mark of 110,000 shareholders, in addition to recording the highest average daily liquidity in the Fund's history, above R$7 million — milestones that reflect the continued growth of the investor base and the asset's maturity in the secondary market.
Together, June's highlights reinforce the Fund's trajectory: an increasingly mature foundation of governance and operational efficiency, capable of absorbing regulatory cost variations such as the Copel adjustment, while sustaining consistent growth in its shareholder base and market liquidity.
PORTFOLIO PERFORMANCE
/>

/>
Installed Cap. 103.5 MWp | No. of Projects: 25 | Operational: 93.2%
/>
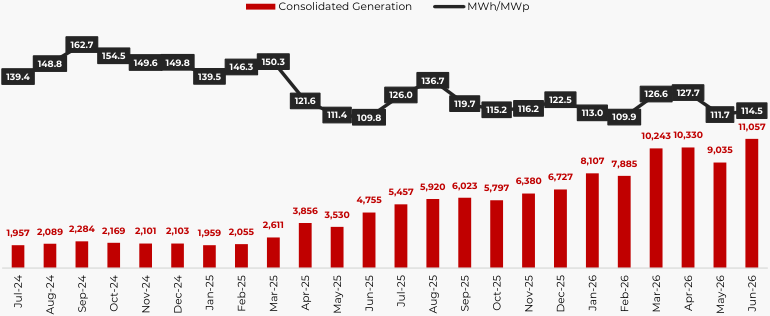
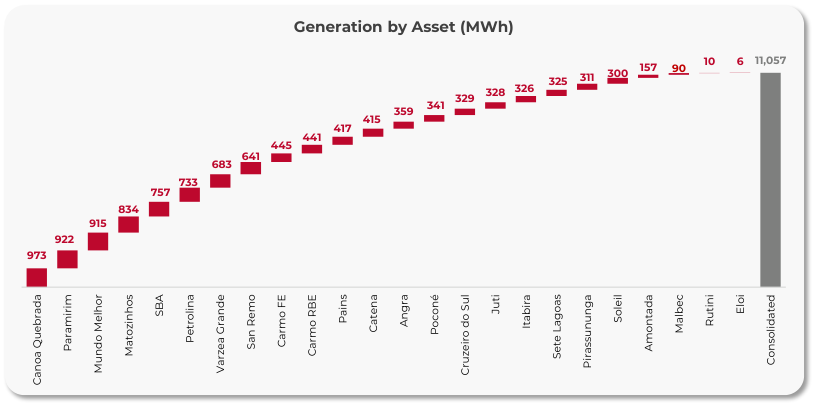
The Poconé, Canoa Quebrada and Várzea assets, whose closing took place in May/26, were included in the charts on this page as from June/26.
PORTFOLIO SUMMARY
/>
25
Projects in the Portfolio
- 12 assets under acquisition
103.5 MWp
Installed Cap.
- 45.8 MWp of assets under acquisition
May/2037
Weighted Avg. Maturity
of the lease agreements
ASSET PORTFOLIO
| Identification | Asset Type | SNEL Stake | Vol SNEL (R$ MM) |
|---|---|---|---|
| Projects Holding FII** | DG FII | 100% | R$ 231.09 |
| DG Projects Liquidity* | Liquidity FII | 100% | R$ 202.96 |
| Assets under Acquisition | Solar Plant | 100% | R$ 162.10 |
| Paramirim | Solar Plant | 100% | R$ 33.54 |
| Petrolina 1,2,3,4 | Solar Plant | 100% | R$ 32.84 |
| Várzea | Solar Plant | 100% | R$ 30.23 |
| San Remo 1 & 2 | Solar Plant | 100% | R$ 29.81 |
| Matozinhos | Solar Plant | 100% | R$ 29.51 |
| Canoa Quebrada | Solar Plant | 100% | R$ 28.93 |
| Cash and Equivalents | Liquidity | - | R$ 24.24 |
| Juti | Solar Plant | 100% | R$ 18.66 |
| Poconé | Solar Plant | 100% | R$ 17.10 |
| Cruzeiro do Sul | Solar Plant | 100% | R$ 16.03 |
| Soleil | Solar Plant | 100% | R$ 15.78 |
| Itabira | Solar Plant | 100% | R$ 14.12 |
| Sete Lagoas | Solar Plant | 100% | R$ 11.62 |
| Amontada 2 | Solar Plant | 90% | R$ 5.59 |
| CRI Pirelli | CRI | - | R$ 3.82 |
| CRI Fametro | CRI | - | R$ 3.55 |
| Rutini | Solar Plant | 100% | R$ 0.47 |
| Elói Mendes | Solar Plant | 100% | R$ 0.30 |
| Total | R$ 912.27 |
- FII Tactical fund used to earn a return on cash while the proceeds are not yet deployed in the ongoing acquisitions.
** FII Structural fund into which the assets acquired in SNEL's 2nd and 3rd offerings were incorporated, except for Micro DG assets.
EXPOSURE BY ASSET
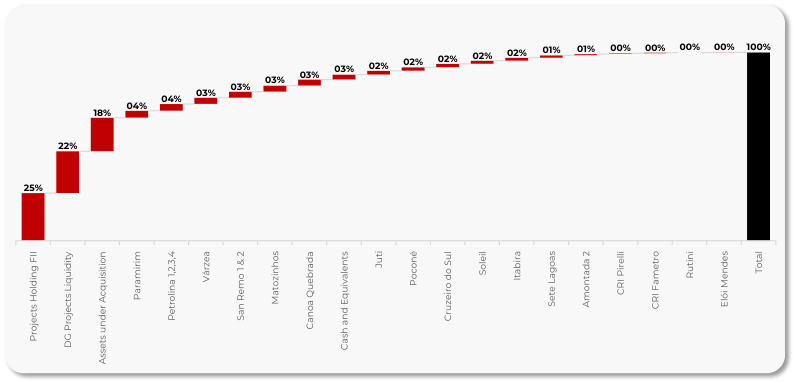
PORTFOLIO SUMMARY
/>
Exposure by Maturity (% MWp)

Exposure by Tenant (% MWp)

Exposure by Lease Type (% MWp)

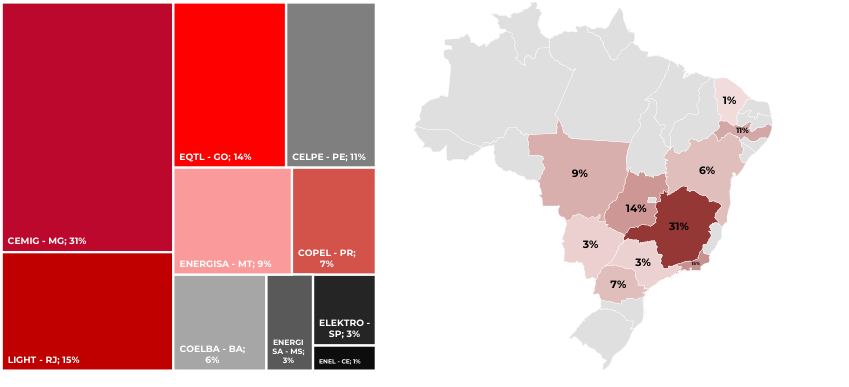
Exposure by Utility (% MWp)
Geographic Exposure (% MWp)
ASSET DETAILS
/>
Photovoltaic Plant Portfolio — June/2026
| Identification | Utility | Phase | Conn. | MWp | Lease | Tenant | Maturity |
|---|---|---|---|---|---|---|---|
| San Remo 1 | CEMIG-MG | Operating | 06/2024 | 1.40 | Take or Pay | Matrix | 02/2039 |
| San Remo 2 | CEMIG-MG | Operating | 03/2024 | 3.36 | Take or Pay | Matrix | 02/2039 |
| Amontada 2 | ENEL-CE | Operating | 02/2024 | 1.20 | Offset | 9Energia | 01/2039 |
| Petrolina 1 | CELPE-PE | Operating | 06/2024 | 1.26 | Take or Pay | Setta | 12/2035 |
| Petrolina 2 | CELPE-PE | Operating | 06/2024 | 1.26 | Take or Pay | Setta | 06/2035 |
| Petrolina 3 | CELPE-PE | Operating | 06/2024 | 1.26 | Take or Pay | Setta | 12/2035 |
| Petrolina 4 | CELPE-PE | Operating | 06/2024 | 1.26 | Take or Pay | Setta | 06/2035 |
| Itabira 1 | CEMIG-MG | Operating | 09/2023 | 3.06 | Offset | Serena | 08/2030 |
| Liberdade | EQTL-GO | Connect. | - | 7.00 | Undefined | Undefined | Undefined |
| Mundo Melhor | EQTL-GO | Operating | 04/2025 | 7.00 | Offset | NUV | 05/2030 |
| São Bento Abade | CEMIG-MG | Operating | 08/2025 | 7.00 | Offset | NUV | 07/2030 |
| Pirassununga | ELEKTRO-SP | Operating | 08/2024 | 3.34 | Take or Pay | Safira | 12/2039 |
| Pains | CEMIG-MG | Operating | 05/2023 | 3.67 | Offset | NUV | 05/2050 |
| Carmo RBE | LIGHT-RJ | Operating | 05/2024 | 5.33 | Offset | NUV | 05/2050 |
| Carmo FE | LIGHT-RJ | Operating | 05/2024 | 5.33 | Offset | NUV | 05/2050 |
| Angra | LIGHT-RJ | Operating | 04/2023 | 4.62 | Offset | NUV | 05/2050 |
| Catena | CEMIG-MG | Operating | 10/2024 | 3.65 | Offset | NUV | 11/2030 |
| Malbec | CEMIG-MG | Operating | 10/2024 | 0.76 | Offset | NUV | 11/2030 |
| Rutini | CEMIG-MG | Operating | 10/2024 | 0.11 | Offset | Juntos | 04/2028 |
| Elói Mendes | CEMIG-MG | Operating | 10/2024 | 0.06 | Offset | Juntos | 04/2029 |
| Paramirim | COELBA-BA | Operating | 08/2025 | 6.72 | Offset | NUV | 01/2030 |
| Cruzeiro do Sul | COPEL-PR | Operating | 04/2025 | 3.37 | Offset | Nextron | 09/2029 |
| Soleil | COPEL-PR | Operating | 10/2024 | 3.37 | Offset | Nextron | 09/2029 |
| Juti | ENERGISA-MS | Operating | 09/2025 | 3.37 | Undefined | Undefined | Undefined |
| Sete Lagoas | CEMIG-MG | Operating | 01/2024 | 2.57 | Undefined | Undefined | Undefined |
| Matozinhos | CEMIG-MG | Operating | 01/2025 | 6.5 | Offset | Performa/ Enercooper | 12/2035 |
| Várzea | CELPE-PE | Operating | 06/2025 | 6.1 | Undefined | Undefined | Undefined |
| Canoa Quebrada | ENERGISA-MT | Operating | 10/2025 | 6.1 | Undefined | Undefined | Undefined |
| Poconé | ENERGISA-MT | Operating | 10/2025 | 3.4 | Take or Pay | Plin | 12/2036 |
| TOTAL | 103.5 | May/2037 |
PERFORMANCE AND RESULTS
/>
INCOME STATEMENT (R$)
| Apr/26 | May/26 | Jun/26 | LTM | 2026 | |
|---|---|---|---|---|---|
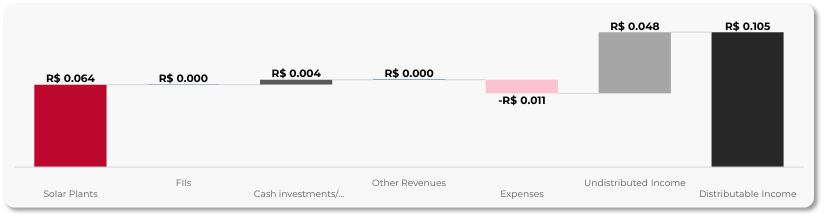
| 1. Revenues | 12,220,800 | 17,958,021 | 7,562,362 | 106,709,944 | 72,606,692 |
| 1.a. Lease Revenue (Solar Plants) | 11,575,060 | 17,337,443 | 7,129,257 | 91,955,190 | 67,211,362 |
| 1.b. Cash investments/movements | 645,740 | 620,578 | 433,106 | 14,754,754 | 5,395,330 |
| 2. Expenses | -1,189,471 | -1,676,812 | -1,201,832 | -12,096,327 | -7,230,848 |
| 2.a. Fund Expenses | -1,155,737 | -1,276,369 | -1,089,235 | -10,891,695 | -6,471,926 |
| 2.b. Non-recurring Expenses | -33,734 | -400,443 | -112,596 | -1,204,632 | -758,922 |
| 3. Net Income for the Period (1+2) | 11,031,329 | 16,281,209 | 6,360,531 | 94,613,618 | 65,375,845 |
| 4. Distributable Income | 11,147,416 | 16,362,618 | 11,657,142 | 94,770,517 | 66,990,689 |
| 4.a. Net Income for the Period (3) | 11,031,329 | 16,281,209 | 6,360,531 | 94,613,618 | 65,375,845 |
| 4.b. Undistributed Income* | 116,088 | 81,409 | 5,296,611 | 156,899 | 1,614,844 |
| 5. Distributed Income | 11,066,007 | 11,066,007 | 11,066,007 | 94,179,381 | 66,399,554 |
| 5.a. Distribution – SNEL11 | 11,066,007 | 11,066,007 | 11,066,007 | 89,400,075 | 66,399,554 |
| 5.b. Distribution – Receipts | 0 | 0 | 0 | 4,779,307 | 0 |
| 5.c. Distribution R$/unit – SNEL11 | 0.10 | 0.10 | 0.10 | 1.20 | 0.60 |
S o u r c e : Q I T e c h
INCOME STATEMENT (R$ / Unit)
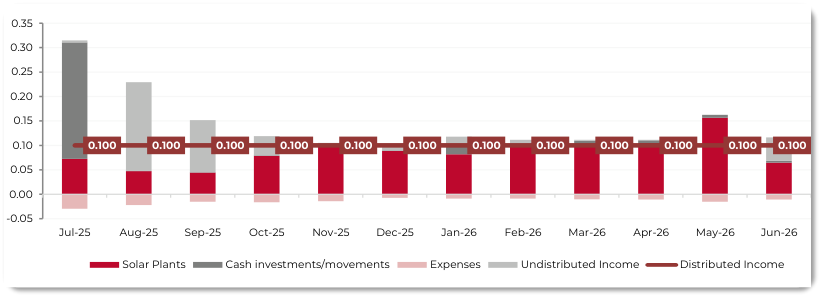
DETAILED MONTHLY RESULT (R$ / Unit)
PERFORMANCE AND RESULTS
/>
80.25 %
/>
34.39 %
/>
/>
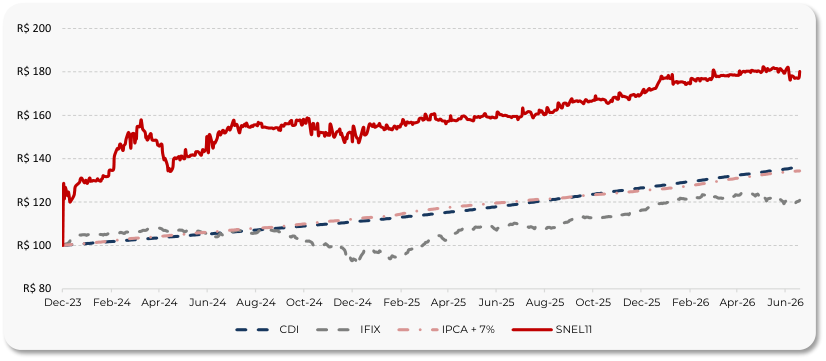
Cum. Return SNEL11 Cum. Return IPCA+7% Cum. Return IFIX Since SNEL11 Listing Since SNEL11 Listing Since SNEL11 Listing
SNEL CUMULATIVE RETURN vs BENCHMARKS SINCE LISTING (Base 100)
AVERAGE DAILY TRADING VOLUME vs NUMBER OF SHAREHOLDERS
SUNO ASSET
/>

LEARN MORE
~~o~~ IG SUNO ASSET
o ~~o~~ YT SUNO ASSET SNEL11 - SUNO ASSET WEBSITE ~~O~~
FAQ
What is SNEL11?
A Suno Asset real estate fund (FII) focused on developing and acquiring photovoltaic plants under the distributed generation model, producing clean energy and recurring income.
Where does the fund invest?
In distributed generation photovoltaic plants, with 25 projects and 103.5 MWp of installed capacity across 10 Brazilian states (MG, RJ, GO, PR, PE, BA, SP, CE, MS, MT).
How does the fund make money?
Through lease agreements on the solar plants under Take or Pay or “offset” structures (variable rent tied to the tenant's benefit).
Are the units liquid?
Yes. Traded daily on B3 (ticker: SNEL11), with average volume above R$ 7.0 million/day and more than 110,000 shareholders.
Are the distributions taxed?
For individual investors, distributed income is exempt from income tax under Brazilian FII legislation. The fund has an FII structure with potential exemption on the projects' revenue.
How are distributions paid?
Monthly payments. In Jun/26, the distribution was R$ 0.10/unit, with an annualized DY of 15.38%. Guidance for the next 3 months: R$ 0.10 to R$ 0.11/unit.
What is the fund's current strategy?
The fund has shifted from greenfield development to acquiring operating solar plants, prioritizing stable results and predictable income.
What does P/BV mean?
The ratio between the unit's market price and its book value. Today the fund trades at 1.04x, a ~4% premium to book value.
Where can I find reports and official information?
On the Suno Asset website → suno.com.br/asset/fundos/snel11
What is distributed generation (DG)?
A system in which plants connected to the local grid generate energy credits for consumers, who pay rent to the fund.
DISCLAIMER
/>
“Investment funds are not guaranteed by the fund administrator, by the portfolio manager, by any insurance mechanism or by the Credit Guarantee Fund – FGC. Past performance is no guarantee of future results. Investors are advised to read the investment fund’s prospectus and bylaws carefully before investing their funds. Investors must be prepared to accept the risks inherent to the various markets in which investment funds operate and, consequently, possible variations in the invested capital. The Administrator is not liable for any errors or omissions in this material, nor for the use of the information contained herein. In addition, the Administrator is not liable for investors’ decisions regarding the subject matter of this material, nor for any act or fact of professionals and specialists consulted by it.
This material does not take into account the specific investment objectives, financial situation or particular needs of any specific recipient, and should not serve as the sole source of information in the investor’s decision-making process. Before deciding, the investor should carry out — preferably with the assistance of a duly qualified professional — a thorough assessment of the product and its risks in light of their personal objectives and risk tolerance (Suitability).
Suno Gestora de Recursos Ltda. (“Suno Asset”) is the manager of the fund(s) covered by this material and belongs to the Suno business group (“Suno Group”), which also comprises Suno Research, Suno Índices and Suno Consultoria. Although part of the Suno Group, these companies have segregated and autonomous structures.”