
Relatório Anual SNEL11 de 31/12/2025
Relatório Anual do Suno Energias Limpas IS (SNEL11), fundo imobiliário de fundos (FoF), com data de referência em 31/12/2025, com entrega no FundosNet (B3) em 16/07/2026. No pregão de 03/11/2026, a cota do SNEL11 fechou a R$ 7,38, com P/VP de 0,92 (valor patrimonial de R$ 7,99 por cota no informe mensal de setembro de 2026). O último rendimento foi de R$ 0,10 por cota, com pagamento em out/2026, e o dividend yield dos últimos 12 meses é de 14,91% sobre a cotação de 03/11/2026. O patrimônio líquido era de R$ 1,8 bilhão no informe mensal de setembro de 2026. Os indicadores são os mais recentes da base do Kartac, não os do período do documento.
Informações
- CNPJ
- 43.741.171/0001-84
- Tipo
- Relatórios
- Assunto
- Relatório Anual
- Data de referência
- 31/12/2025
- Data de entrega
- 16/07/2026 20:01
- Versão
- 1
- Situação
- (Inativo)
Conteúdo
A S S E T
/>
/>
A N N U A L R E P O R T 2025
ANNUALIZED DY 14.97% based on market price
DISTRIBUTION/SHARE (2025) R$ 1.20 BRL/USD $0.18 (as of Dec. 31, 2025)
NET ASSET VALUE R$ 909.4 MM 24 PV Plants – 78.7 MWp
CONTENTS
| Executive Summary · · · · · · · · · · · · · · · | 03 |
|---|---|
| Investment Thesis · · · · · · · · · · · · · · · | 04 |
| Manager’s Letter· · · · · · · · · · · · · · · | 05 |
| Portfolio Performance · · · · · · · · · · · · | · · · 06 |
| Portfolio Summary · · · · · · · · · · · · · · · | 07 |
| Asset Details· · · · · · · · · · · · · · · | 09 |
| Performance & Results· · · · · · · · · · · | · · · · 10 |
| FAQ· · · · · · · · · · · · · · · | 12 |
SNEL11 Annual Report — 2025
EXECUTIVE SUMMARY
/>
Portfolio Manager
Suno Gestora de Recursos LTDA
Performance Fee
20% over benchmark (IPCA + 7%)
Administrator
QI Corretora de Títulos e Valores Imobiliários S.A. Fund Inception December 2022
Management Fee
1.08% p.a.
Administration Fee 0.12% p.a.
2025 HIGHLIGHTS
In 2025, the Fund completed its 4th public offering, raising R$ 622.0 million — net worth grew 192% and the shareholder base expanded 82% between June and December. Proceeds are being deployed into 20 signed acquisition agreements for solar DG assets totaling 87.5 MWp (R$ 436.2 million, projected real IRR of 14.44% p.a.), of which 16.9 MWp had already completed closing by December: Paramirim, Cruzeiro do Sul, Soleil and Juti.
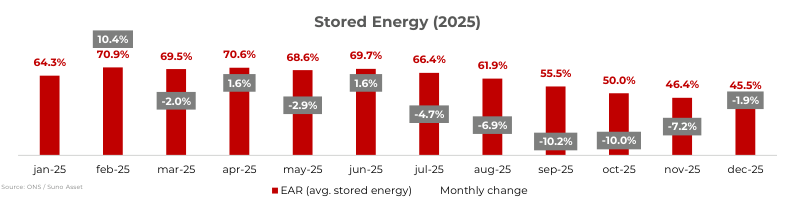
The year was also marked by a sharp drawdown in hydro reservoirs — stored energy (EAR) fell from 69.7% in June to 45.5% in December — driving tariff-flag volatility. In the portfolio, the Fund concluded the full exit of Lemon from the Petrolina project, immediately re-leasing the units to Setta Energia under 10-year Take or Pay agréments.
Dividend Yield (annualized) 14.97%
No. of Projects 44
Net Asset Value R$ 909.4 MM
P/BV 1.04x
Distribution per Share (2025) R$ 1.20 Market/Book Value per Share R$ 8.55/R$ 8.22
(Including projects under acquisition)
Installed Capacity
166.2 MWp
(Including projects under acquisition)
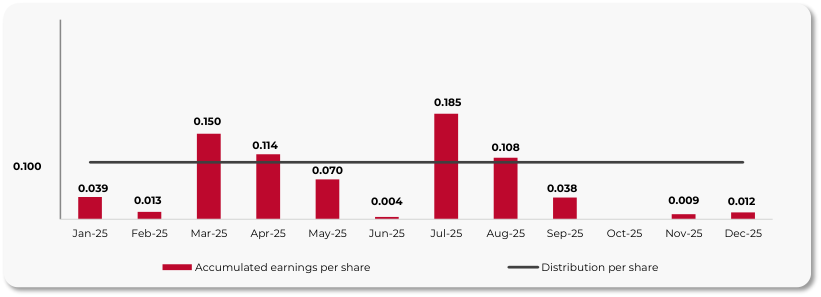
Accumulated Earnings per Share R$ 0.012
Market Cap R$ 946.3 MM
Total Return (Dec/25)
13.93%
Cash & Equivalents R$ 62.7 MM
(6.7% of Assets)
Number of Shareholders
63,023
INVESTMENT THESIS
/>
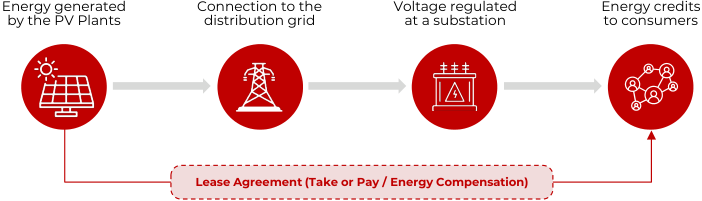
SNEL11 is an FII (Brazilian real estate fund) focused on real estate ventures linked to clean energy generation, with long-term lease agreements that provide predictability and stability in revenue generation.
Its scope ranges from the technical analysis and initial evaluation of the projects, through legal due diligence conducted by specialized third-party law firms, to the ongoing monitoring and operation of the assets.
PROJECT STRUCTURE
INVESTMENT PROCESS

Pipeline Asset Investment Negotiation / Investment Asset
Origination Analysis Committee Structuring Management
THESIS ADVANTAGES
Double-Digit Real Returns Income Tax Exemption (FII) Projects leased to consortia or end FII structure with potential income tax consumers with projected double-digit real exemption on revenues returns Sector Specialists Energy Transition Energy sector consultants and specialists Contribution to the country’s energy directly involved in the thesis. transition, reducing GHG emissions and increasing energy security
MANAGER’S LETTER
/>
MARKET PERFORMANCE
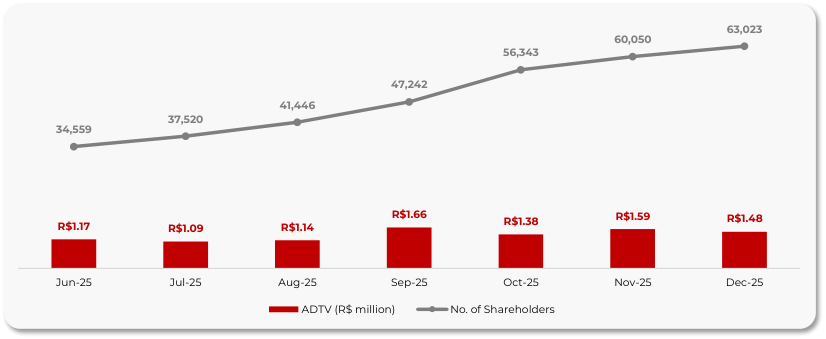
Regarding December results, the Fund distributed R$ 0.10 per share — completing R$ 1.20 for 2025 — an annualized Dividend Yield of 14.97% at the December close. Shares moved from R$ 8.48 to R$ 8.55 (total return 2.02%; CDI 1.22%; benchmark 0.90%). Monthly volume reached R$ 29.6 million (ADTV R$ 1.48 million), and the shareholder base ended the year at 63,023 investors.
MANAGER’S COMMENTS
Dear investors, 2025 was shaped by a sharp drawdown in Brazil’s hydro reservoirs: stored energy (EAR) fell from 69.7% in June to 45.5% in December — a retraction of 24.2 p.p. — driving tariff-flag volatility and the dispatch of more expensive generation sources. Monthly declines peaked above 10% in September and October, but slowed to -1.9% in December, when ANEEL moved the tariff flag back to yellow (R$ 1.885 per 100 kWh, vs. R$ 4.46 under the red flag), suggesting the beginning of a hydrological recovery with the first year-end rains.
2025 CAPITAL DEPLOYMENT
The Fund closed its 4th public offering with proceeds of R$ 622.0 million (net worth +192% vs. June) and signed 20 acquisition agreements totaling 87.5 MWp — R$ 436.2 million, projected real IRR of 14.44% p.a., across 22 cities in 8 states (material fact of Jan/26). Key portfolio events of the year, beyond the assets that completed closing, are summarized below:
Petrolina Re-tenanting
The Fund formalized the full exit of Lemon from the Petrolina project (PV Plants 1– 4). Over 60 months, the former tenant will still pass through the residual amounts due as rent, related to credits accrued and not used during the lease. The units were immediately re-leased to Setta Energia under 10-year Take or Pay agreements (termination penalty of 12 rents; 12-month prior notice), with rent deferrals of 6 and 12 months repayable between the 20th and 31st month of the lease.
Annual Appraisals (CVM 516)
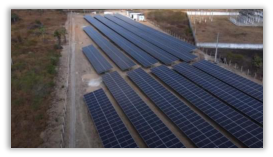
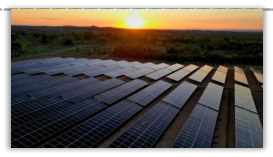
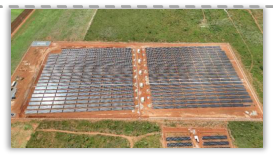
As required by CVM Instruction 516/11, the San Remo, Petrolina, Amontada 2 and Itabira assets were re-appraised at fair value by independent experts: San Remo +22% (lease step-up and operating efficiency gains), Amontada 2 +1%, Petrolina -5% and Itabira -12% (tenant replacements at slightly lower rents). Combined value rose 2%, from R$ 80.3 million to R$ 81.9 million. (Pictured: PV Plant San Remo)
December Closings — 16.9 MWp
Among the new acquisitions, PV Plant Paramirim (5 MW / 6.72 MWp), PV Plant Cruzeiro do Sul and PV Plant Soleil (2.5 MW / 3.4 MWp each) and PV Plant Juti (2.5 MW / 3.37 MWp) cleared all conditions precedent and completed closing, being fully integrated into the portfolio. Details are available in the “PV Plant Portfolio” section of this report. (Pictured: PV Plant Mundo Melhor)
PORTFOLIO PERFORMANCE
/>

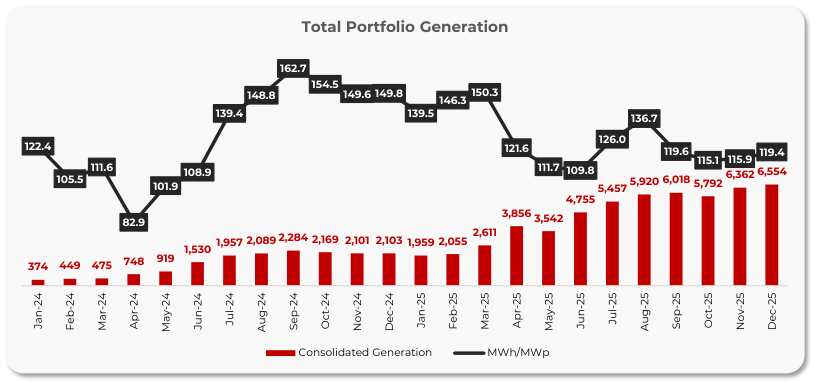
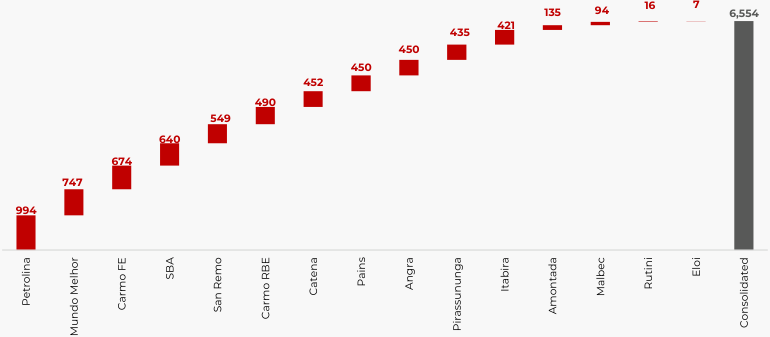
6,554 119.4 +219% ↑
Total Generation (MWh) MWh / MWp Annual generation growth
Consolidated portfolio — Dec/25 Efficiency Indicator — Dec/25 2025 (54,881 MWh) vs. 2024
↑
/>
/>
16 7
135 94 6,554
421
435
450
450
452
490
549
640
674
747
994
Petrolina Mundo Melhor Carmo FE SBA San Remo Carmo RBE Catena Pains Angra Pirassununga Itabira Amontada Malbec Rutini Eloi Consolidated
Following completion of the title transfer of the Catena and Malbec PV Plants to NUV Energia, their performance is included in the figures above as from November 2025
PORTFOLIO SUMMARY
/>
SUNO( AsseT)
24
Projects in the Portfolio
- 20 assets under acquisition
78.7 MWp
Installed Capacity
- 87.5 MWp under acquisition
Jul/2037
Weighted Avg. Maturity.
of the lease agreements
ASSET PORTFOLIO
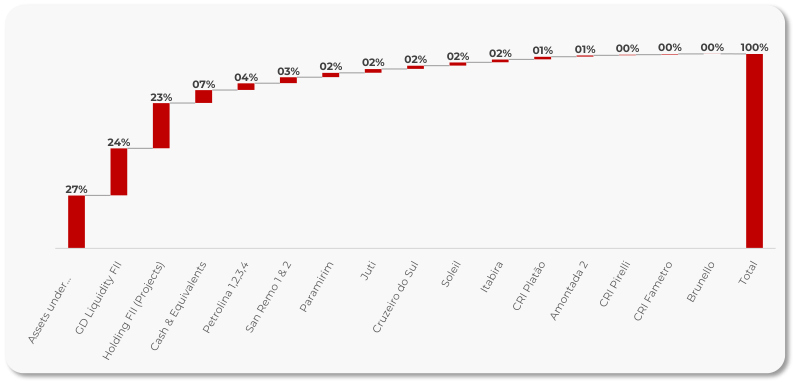
| Asset | Asset Type | SNEL Stake | SNEL Vol. (R$ MM) |
|---|---|---|---|
| Assets under Acquisition | PF Plants | 100% | R$ 254.40 |
| GD Liquidity FII* | Liquidity FII | 100% | R$ 226.56 |
| Holding FII (Projects)** | GD FII | 100% | R$ 217.82 |
| Cash & Equivalents | Cash | - | R$ 62.73 |
| Petrolina 1,2,3,4 | PF Plant | 100% | R$ 32.79 |
| San Remo 1 & 2 | PF Plant | 100% | R$ 28.78 |
| Paramirim | PF Plant | 100% | R$ 21.63 |
| Juti | PF Plant | 100% | R$ 18.56 |
| Cruzeiro do Sul | PF Plant | 100% | R$ 15.93 |
| Soleil | PF Plant | 100% | R$ 15.60 |
| Itabira | PF Plant | 100% | R$ 14.11 |
| CRI Platão | CRI | - | R$ 13.25 |
| Amontada 2 | PF Plant | 90% | R$ 5.59 |
| CRI Pirelli | CRI | - | R$ 3.81 |
| CRI Fametro | CRI | - | R$ 3.74 |
| Brunello | PF Plant | 100% | R$ 0.85 |
| Total | R$ 936.14 |
- Tactical FII used to earn a return on cash while proceeds are pending deployment into the ongoing acquisitions.
** Structural FII holding the assets acquired in SNEL’s 2nd and 3rd offerings, except the Micro-GD assets.
EXPOSURE BY ASSET
03% 02% 02% 02% 02% 02% 01% 01% 00% 00% 00% 100%
04%
07% me m m — -
23%
24%
27%
| . |
Sp RN Y £ ? 5 5 q q vos o e >
é $ 9 » É > 2 2 x g o 8 £ x 2
Cs Es LES e e $$ E E &
SSL ss gs La Ê [o
Zoo e FÊ Ê & “ n
Ed
PORTFOLIO SUMMARY
/>
SUNO ( AsseT)
Exposure by Lease Maturity (% MWp)
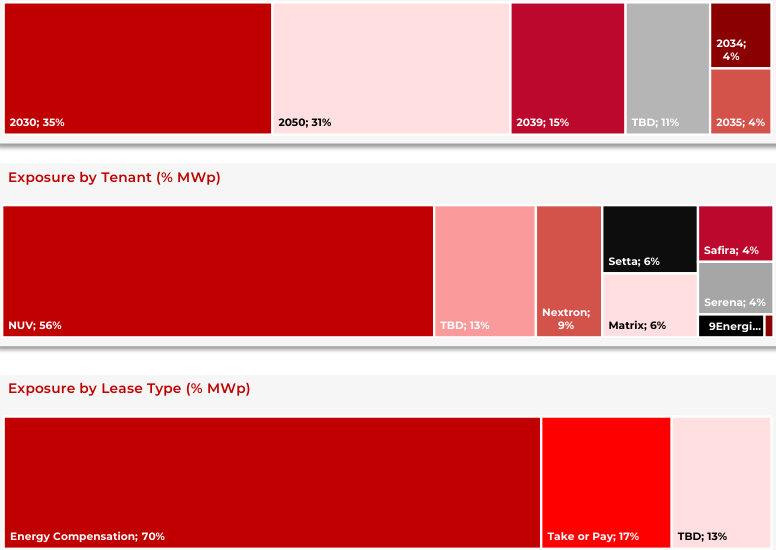
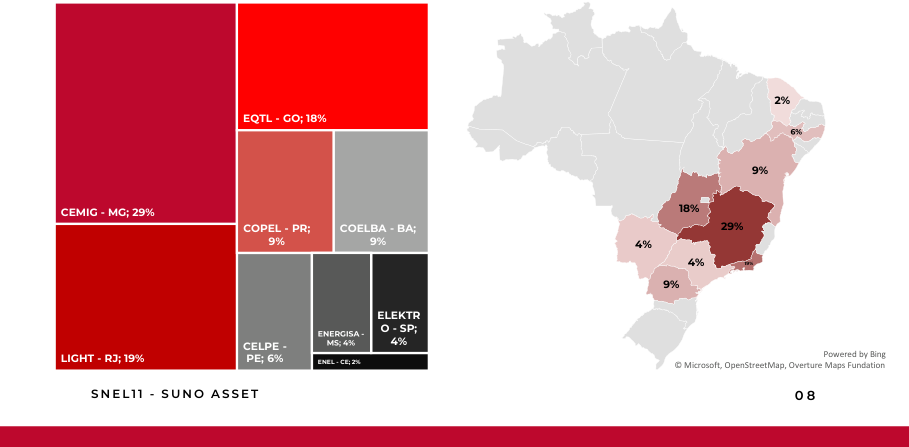
Exposure by Distributor (% MWp)
Geographic Exposure (% MWp)
2%
EQTL - GO; 18%
6%
9%
CEMIG - MG; 29% 18%
COPEL - PR; COELBA - BA; 29%
9% 9% 4%
4% 19%
9%
ELEKTR
ENERGISA - O - SP;
CELPE - MS; 4% 4%
E LIGHT - RJ; 19% PE; 6% ER ENEL - CE; 2% © Microsoft, OpenStreetMap, Overture Maps FundationPowered by Bing
S N E L 1 1 - S U N O A S S E T 0 8
o
ASSET DETAILS
/>
PV Plant Portfolio — December 2025
| Asset San Remo 1 | Distributor CEMIG-MG | Status Operational | Conn. 06/2024 | MWp 1.40 | Lease Type Take or Pay | Tenant Matrix | Maturity 02/2039 |
|---|---|---|---|---|---|---|---|
| San Remo 2 | CEMIG-MG | Operational | 03/2024 | 3.36 | Take or Pay | Matrix | 02/2039 |
| Amontada 2 | ENEL-CE | Operational | 02/2024 | 1.20 | Compensation | 9Energia | 01/2039 |
| Petrolina 1 | CELPE-PE | Operational | 06/2024 | 1.26 | Take or Pay | Setta | 12/2035 |
| Petrolina 2 | CELPE-PE | Operational | 06/2024 | 1.26 | Take or Pay | Setta | 06/2035 |
| Petrolina 3 | CELPE-PE | Operational | 06/2024 | 1.26 | Take or Pay | Setta | 12/2035 |
| Petrolina 4 | CELPE-PE | Operational | 06/2024 | 1.26 | Take or Pay | Setta | 06/2035 |
| Itabira 1 | CEMIG-MG | Operational | 09/2023 | 3.06 | Compensation | Serena | 08/2030 |
| Liberdade | EQTL-GO | Connection | - | 7.00 | TBD | TBD | TBD |
| Mundo Melhor | EQTL-GO | Operational | 04/2025 | 7.00 | Compensation | NUV | 05/2030 |
| São Bento Abade | CEMIG-MG | Operational | 08/2025 | 7.00 | Compensation | NUV | 07/2030 |
| Pirassununga | ELEKTRO-SP | Operational | 08/2024 | 3.34 | Take or Pay | Safira | 12/2039 |
| Pains | CEMIG-MG | Operational | 05/2023 | 3.67 | Compensation | NUV | 05/2050 |
| Carmo RBE | LIGHT-RJ | Operational | 05/2024 | 5.33 | Compensation | NUV | 05/2050 |
| Carmo FE | LIGHT-RJ | Operational | 05/2024 | 5.33 | Compensation | NUV | 05/2050 |
| Angra | LIGHT-RJ | Operational | 04/2023 | 4.62 | Compensation | NUV | 05/2050 |
| Catena | CEMIG-MG | Operational | 10/2024 | 3.65 | Compensation | NUV | 11/2030 |
| Malbec | CEMIG-MG | Operational | 10/2024 | 0.76 | Compensation | NUV | 11/2030 |
| Rutini | CEMIG-MG | Operational | 10/2024 | 0.11 | Compensation | Juntos | 04/2028 |
| Elói Mendes | CEMIG-MG | Operational | 10/2024 | 0.06 | Compensation | Juntos | 04/2029 |
| Paramirim | COELBA-BA | Operational | 08/2025 | 6.72 | Compensation | NUV | 01/2030 |
| Cruzeiro do Sul | COPEL-PR | Operational | 04/2025 | 3.37 | Compensation | Nextron | 09/2029 |
| Soleil | COPEL-PR | Operational | 10/2024 | 3.37 | Compensation | Nextron | 09/2029 |
| Juti TOTAL | ENERGISA-MS | Operational | 09/2025 | 3.37 78.7 | TBD | TBD | TBD Jul/2037 |
PERFORMANCE & RESULTS
/>
SUNO( AsseT)
INCOME STATEMENT (R$)
| 2024 | 2025 | |
|---|---|---|
| 1. Revenues | 22,816,373 | 54,152,495 |
| 1.a. Lease Revenue (PV Plants) | 3,801,026 | 31,124,392 |
| 1.b. Cash Mgmt / Investments | 19,015,344 | 23,028,103 |
| 2. Expenses | -2,817,863 | -8,023,587 |
| 2.a. Fund Expenses | -1,989,070 | -6,490,672 |
| 2.b. Non-recurring Expenses | -828,794 | -1,532,915 |
| 3. Net Income (1+2) | 19,998,509 | 46,128,908 |
| 4. Distributable Result | 21,354,541 | 47,484,938 |
| 4.a. Net Income (3) | 19.998.509 | 46,128,908 |
| 4.b. Retained Earnings* | 1,356,032 | 1,356,030 |
| 5. Distributed Income | 19,792,528 | 46,308,823 |
| 5.a. Distribution – SNEL11 | 19,459,475 | 40,170,237 |
| 5.b. Distribution – Receipts | 333,053 | 6,138,585 |
| 5.c. Distribution R$/share – SNEL11 | 8.45 | 1.20 |
S o u r c e : S i n g u l a r e / S u n o A s s e t
ACCUMULATED EARNINGS vs. DISTRIBUTION (R$/SHARE)
DETAILED MONTHLY RESULT — DEC/25 (R$/SHARE)
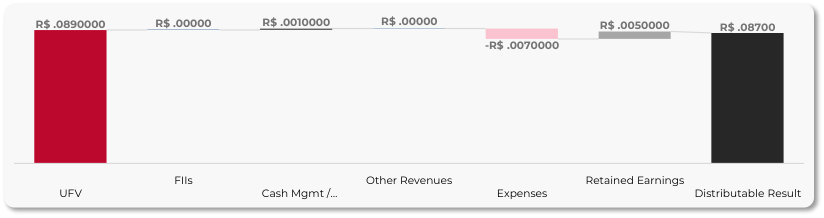
R$ .0890000 R$ .00000 R$ .0010000 R$ .00000 R$ .0050000 R$ .08700
-R$ .0070000
FIIs Other Revenues Retained Earnings
UFV Cash Mgmt / … Expenses Distributable Result
PERFORMANCE & RESULTS
/>
/>
↑
/>
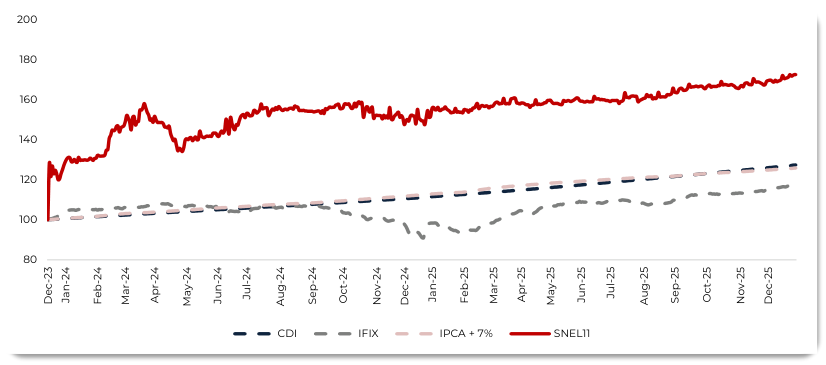
72.39 %
Cum. Return – SNEL11 Cum. Return – IPCA+7%
Since SNEL11 listing (as of Dec 13, 2023)
Since SNEL11 listing (as of Dec 13, 2023)
/>
/>
Cum. Return – IFIX
Since SNEL11 listing (as of Dec 13, 2023)
CUMULATIVE RETURN — SNEL vs. BENCHMARKS SINCE LISTING (Base 100)
AVG. DAILY TRADED VOLUME x NO. OF SHAREHOLDERS (JUN–DEC/25)
63,023
60,050
56,343
47,242
41,446
37,520
34,559
R$1.66 R$1.38 R$1.59 R$1.48
R$1.17 R$1.09 R$1.14
Jun-25 Jul-25 Aug-25 Sep-25 Oct-25 Nov-25 Dec-25
ADTV (R$ million) No. of Shareholders
SUNO ASSET
/>
SUNO ( AsseT)
A;SNAGnI
(& SNELT

LEARN MORE
IG SUNO ASSET
YT SUNO ASSET
SNEL11 - SITE SUNO ASSET
FAQ
What is SNEL11?
A Suno Asset FII (Brazilian real estate fund) focused on developing and acquiring photovoltaic plants (PF Plants) under the distributed generation model, producing clean energy and recurring income.
Where does the fund invest?
In distributed-generation photovoltaic plants (PV Plants): 24 projects and 78.7 MWp of installed capacity across 9 Brazilian states (MG, RJ, GO, PR, PE, BA, SP, CE, MS), plus 87.5 MWp under acquisition.
How does the fund make money?
Through PV Plant lease agreements under the Take or Pay or energy compensation (“compensada”) models — the latter a variable rent tied to the tenant’s realized benefit.
Are the shares liquid?
Yes. Traded daily on B3 (ticker: SNEL11), with volume averaging around R$ 1.5 million/day in Dec/25 and more than 63 thousand shareholders.
How are distributions paid?
Are distributions taxed?
For individuals, distributed income is exempt from income tax under Brazilian FII legislation. The FII structure also allows potential tax exemption on project revenues.
Monthly payments. The Fund distributed R$ 0.10/share in every month of 2025 — R$ 1.20 in the year — with an annualized DY of 14.97% in December.
What does P/BV mean?
What is the fund’s current strategy?
The fund evolved from greenfield development to acquiring operational PV Plants, prioritizing earnings stability and distribution predictability.
The ratio between market price and book value per share. The fund closed 2025 at 1.04x — a ~4% premium to book value.
What is distributed generation (GD)?
What is the status of PV Plant Liberdade (GO)?
Construction is complete; the 7 MWp plant awaits grid connection by Equatorial Goiás. The manager is pressing all parties, including possible litigation, to accelerate the connection.
A model in which plants connected to the local grid generate energy credits for consumers, who pay rent to the fund.