
Relatório gerencial em inglês SNME11 de junho de 2026
Relatório gerencial em inglês do Suno Multiestratégia (SNME11), fundo imobiliário de fundos (FoF), referente a junho de 2026, com entrega no FundosNet (B3) em 29/07/2026. No pregão de 04/11/2026, a cota do SNME11 fechou a R$ 9,30, com P/VP de 0,95 (valor patrimonial de R$ 9,78 por cota no informe mensal de setembro de 2026). O último rendimento foi de R$ 0,10 por cota, com pagamento em out/2026, e o dividend yield dos últimos 12 meses é de 14,73% sobre a cotação de 04/11/2026. O patrimônio líquido era de R$ 170,7 milhões no informe mensal de setembro de 2026. Os indicadores são os mais recentes da base do Kartac, não os do período do documento.
Informações
- CNPJ
- 52.227.760/0001-30
- Tipo
- Outras Informações
- Assunto
- Relatório gerencial em inglês
- Data de referência
- 30/06/2026
- Data de entrega
- 29/07/2026 19:44
- Versão
- 1
- Situação
- (Ativo)
Conteúdo
SNME11
M A N A G E M E N T R E P O R T
TA B L E O F CO NTE NTS
- Executive Summary 03
- Manager's Letter 04
- Macroeconomic Scenario 06
- Portfolio Overview 07
- Asset Breakdown 09
- Asset Monitoring 10
- Accounting Information 11
- Performance 1 2
- Suno Asset / FAQ 13
SNME11 Management Report — June/2026
EXECUTIVE SU M MARY
Manager Suno Gestora de Recursos LTDA Administrator BTG Pactual Serviços Financeiros S.A. Fund Inception October/2021
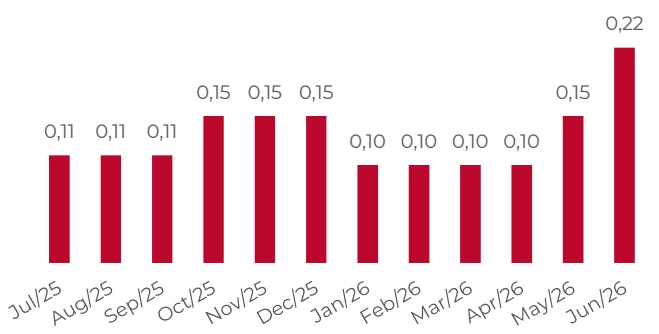
The distribution for June was R$ 0.22/share, representing an annualized Dividend Yield of 32%. The fund closed the month with a market share price of R$ 9.40 and a book value of R$ 9.63, resulting in a P/BV of 0.98x. The average yield of the CRI portfolio is 19.24%, with a Duration of 0.5 years.
The highlight of the month was the transaction involving RLGX11, resulting from the spin-off of RELG11, which delivered an IRR of 52.5% and income of R$ 0.16 per SNME11 share for the month. Further details on the transaction are described in the Manager's Letter.
Distribution History (12 months)
Shareholder Base
Distribution per Share
D.Y. 12 months
D.Y. Annualized
R$ 0.22
16.91%
32.00%
P/BV
0.98
Market Price per Share
Book Value per Share
R$ 9.40
R$ 9.63
Average Portfolio Yield
Weighted Portfolio Duration
Weighted Average LTV
19.24%
0.5 years
55.30%
Alpha vs Benchmark
Net Asset Value
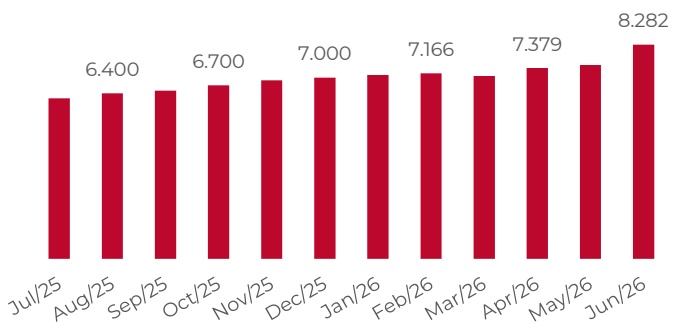
Number of shareholders
6.39%
R$ 71.41 MM
8,282
$$ \mathbb { W } \triangle \mathbb { W } \triangle \mathbb { C } \mathsf { E } \mathsf { R } ^ { 1 } \mathsf { S } \perp \mathsf { E } \sqsubset \mathsf { E } \mathsf { R } $$
$$ \textsf { S U N O } \Big ( \textsf { A S S E T } \Big ) $$
SNME11 closed the month of June with distributable income of R$ 0.2440 per share, and a provision of R$ 0.2200 per share distributed on 07/27/2026, leaving R$ 0.0669 in total accumulated distributable reserve. The annualized DY stood at 31.88%.
Regarding income distribution, SNME11 is expected to distribute its recurring income over the coming months, with the entire accumulated reserve to be distributed prior to the completion of the merger/absorption of SNFF11/KISU11 by SNME11. Any new information will be promptly disclosed by the Administrator and Manager.
On the transactions side, SNME11 carried out a further tranche of the arbitrage strategy with the asset RBVA11, a transaction that contributed R$ 117,000 in capital gains. Along the same lines, the Fund executed the same strategy with the asset SNEL11, acquiring in the secondary market, at a discount, a lot of approximately R$ 6 million, which added R$ 102,000 to income for the month. R$ 5 million of the security remains in the portfolio, and its gradual reduction should unlock additional income over the coming months. It is worth noting that the transaction was executed entirely on the exchange, without any subscription by SNME11 in the current SNEL11 offering. Over the first half of the year, the strategy generated approximately R$ 869,000 in capital gains, or R$ 0.11 per share, demonstrating Management’s ability to earn additional returns through structured transactions and reinforcing the Fund’s multi-strategy mandate.
The main source of income for the month was the liquidation and amortization of RLGX11, a fund originating from the spin-off of RELG11, which delivered an IRR of 52.5% p.a. and distributable profit of R$ 0.16 per SNME11 share. The investment began on 07/15/2024, with a thesis grounded in the acquisition of a portfolio substantially discounted relative to its fair value, providing a satisfactory margin of safety and considerable potential for capital gains. Since then, part of SNME11’s transaction flow was allocated to acquiring the asset over the following months, making it one of the largest positions in the portfolio. The thesis reached maturity in June 2026, 23 months after the first allocation.
It is also worth noting that part of the RLGX11 liquidation was settled in GGRC11 shares. Accordingly, with the aim of anticipating the sale of the asset, SNME11 initiated a short (shortselling) strategy on the security, disposing of the entire position to be received at an average price of R$ 10.00 per share, 3.0% above the closing price on the date the amortization was received. The transaction increased income by R$ 146,000 and locked in the exit price of the position, eliminating exposure to market risk over the period.
$$ \mathbb { W } \triangle \mathbb { W } \triangle \mathbb { C } \mathsf { E } \mathsf { R } ^ { 1 } \mathsf { S } \perp \mathsf { E } \sqsubset \mathsf { E } \mathsf { R } $$
$$ \textsf { S U N O } \Big ( \textsf { A S S E T } \Big ) $$
Still in the context of the transaction, it is worth highlighting that good investment opportunities often arise in temporarily distressed vehicles. In such cases, the market tends to penalize secondary market prices excessively, creating attractive conditions for investments with an adequate margin of safety. It is up to the Manager to identify and analyze these opportunities in order to build a diversified portfolio with a solid risk/return profile.
All transactions during the month contributed R$ 1,519,000 in gross income, or R$ 0.20 per share.
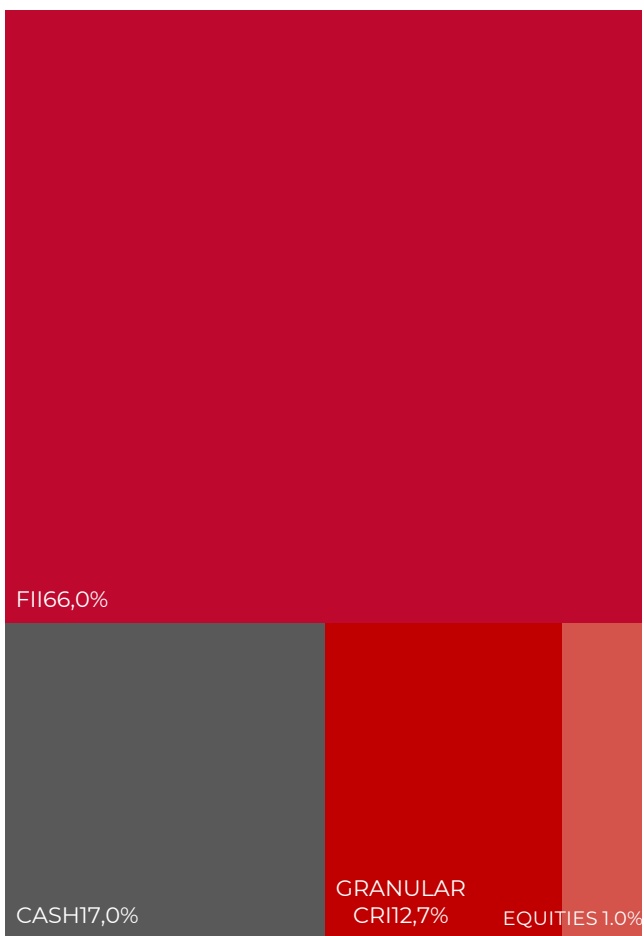
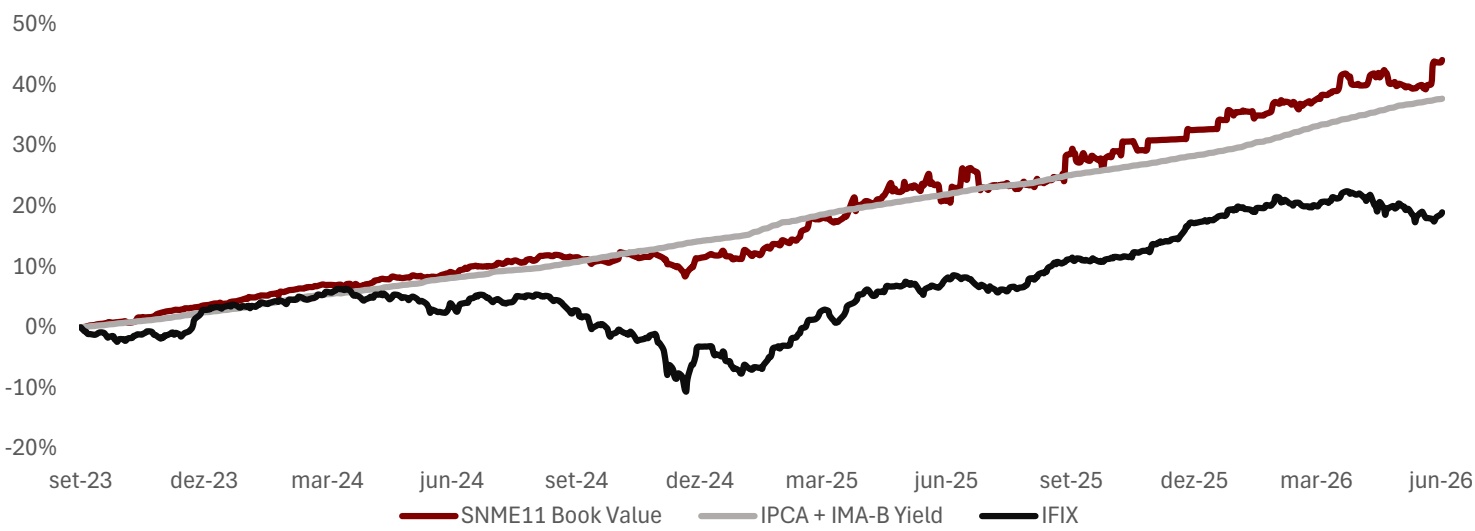
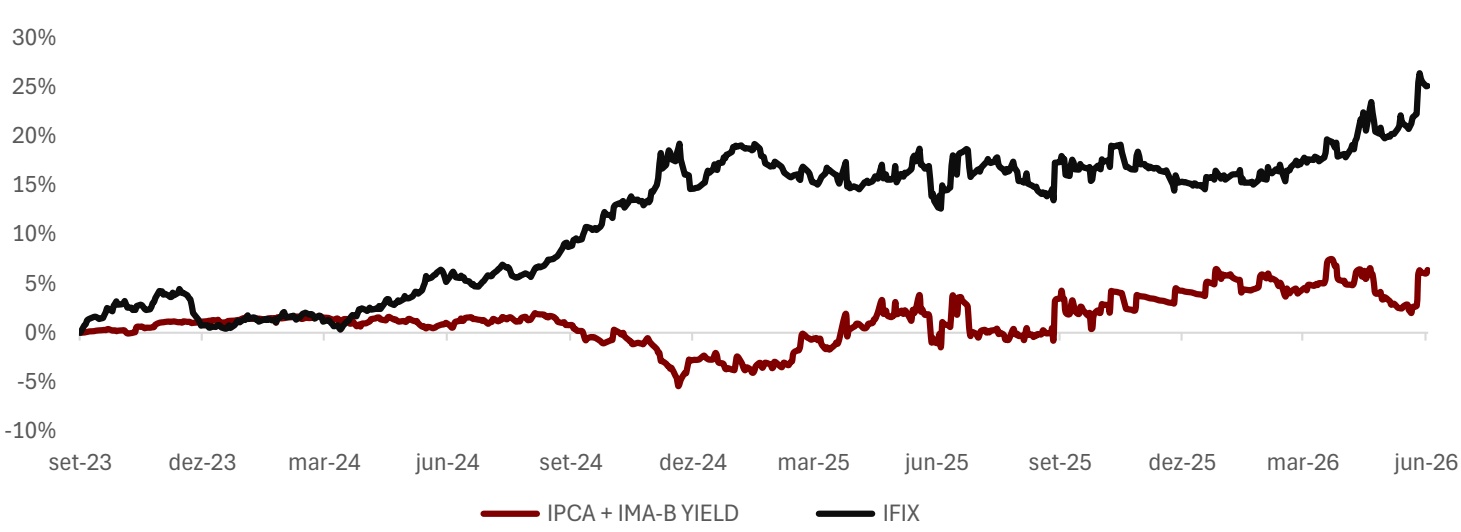
SNME11 posted a total book value return of 3.92% for the month, versus -1.21% for the IFIX and 0.84% for IPCA + IMA-B Yield. The fund closed the period with accumulated Alpha of 6.39% vs IPCA + IMA-B Yield and +25.14% vs IFIX since Sep/23. The portfolio ended the month with CRIs (13.0%), FIIs (68.8%), Equities (2.0%) and Cash (16.3%).
In Management’s view, the cash position will be important over the coming months, given the volatility observed in the equity market in 1H26. With a robust level of liquidity, SNME11 is expected to take advantage of this environment for attractive new allocations, while also reducing net asset value volatility in the short term.
MACRO SCENARIO
Interest Rate (Selic) 0.25 p.p. cut expected in Jun/26
4.64% IPCA 12 months Inflation still above target

NTN-B 2035 Yield Conservative CRI portfolio

| Interest Rate - Selic | 14.25% |
|---|---|
| IPCA (2026e) | 5.15% |
| FX (R$/USD average for the period) | R$ 5.15 |
| Brazil GDP (2026e) | 1.99% |
| Unemployment Rate (2026e) | 5.6% |
| Gross Debt (% of GDP) | 83.2% |
Scenarios for the Selic Rate Path (% p.a.)
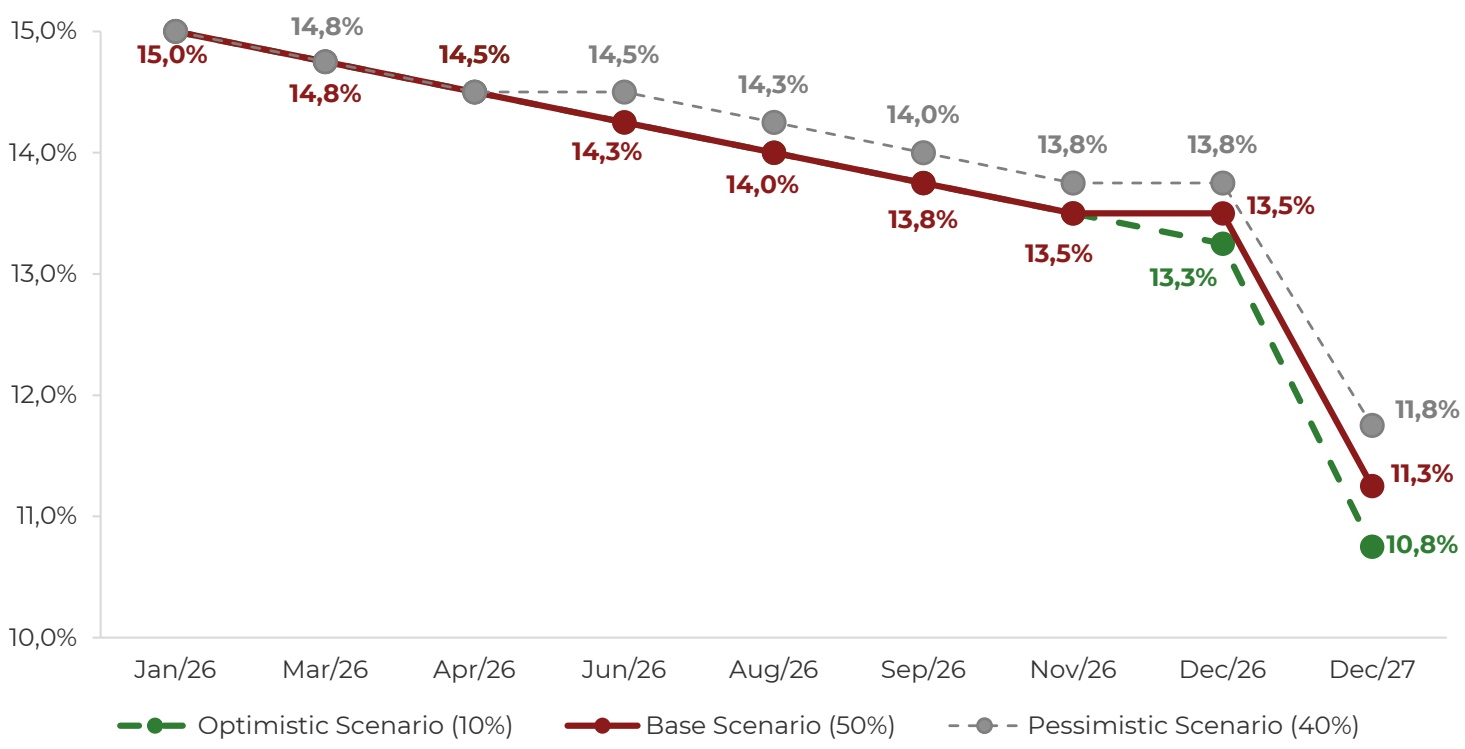
Source: Gustavo Sung – Chief Economist at Suno Research
PORTFOLIO OVERVI EW
Diversification per Issuer
The fund holds a portfolio of 29 assets, consisting of 4 CRIs and 25 FIIs/Equities. The fund’s largest exposure is currently in FIIs, at 63% of the portfolio, followed by Cash at 16% and CRIs at 12%. We believe this positioning tends to benefit the fund in the event of a Selic rate cut. In addition, the fund has carried out selective portfolio turnover in order to unlock gains and generate liquidity.
29
Assets in Portfolio 4 CRIs + 25 FIIs/Equities
R$ 71.41 MM
Net Asset Value MV: R$ 69.73 MM
19.24%
Weighted CRI Yield HTM: 7.21%
55.30%
Weighted Average LTV Conservative portfolio
+6.39%
+6.39% IPCA + IMA-B Yield
0.98
P/BV Share R$ 9.40 / BV R$ 9.63
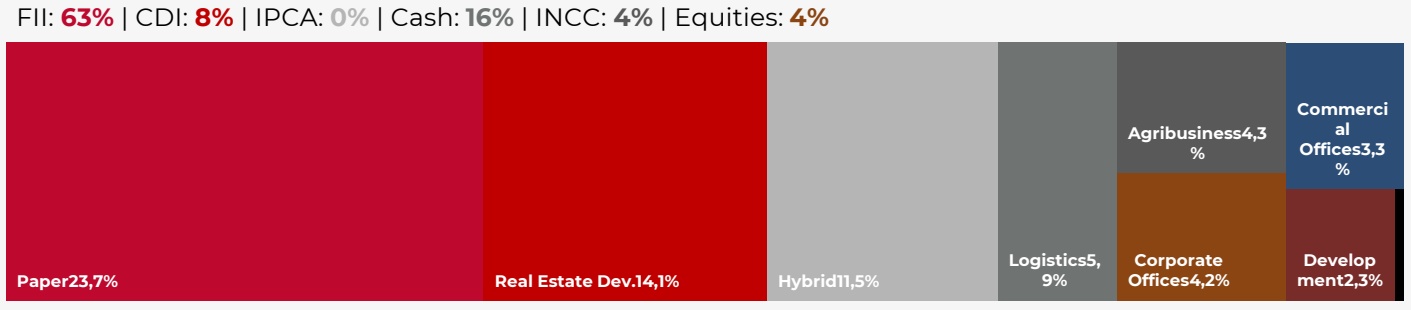
FII: 63% | CRI: 12% | Equities: 4% | Cash: 16%
ALLOCATION BY ASSET (% of NAV)
| Asset | % NAV |
|---|---|
| Alianza Renda+ | 13.94% |
| SNEL11 | 8.00% |
| TRXY11 | 6.31% |
| SNFZ11 | 4.25% |
| IBBP11 | 4.17% |
| RBRP11 | 3.73% |
| IRIM11 | 3.72% |
| CRI VANGUARDA | 3.71% |
| CRI BIT | 3.64% |
| CXCO11 | 3.32% |
| CRI BIT Series 2 | 3.16% |
| VRTM11 | 3.02% |
| PCIP11 | 2.66% |
| TGAR11 | 2.12% |
| MCMV18 | 1.63% |
| CRI ARPOADOR (SENIOR) | 1.60% |
| INOI11 | 1.56% |
| PSEC11 | 1.55% |
| PATL11 | 0.97% |
EXPOSURE BY ASSET TYPE
PORTFOLIO OVERVI EW
EXPOSURE BY SECTOR (% of NAV)
CRI: EXPOSURE BY INDEX (% of NAV)
EXPOSURE BY RATING (% of NAV)
AVERAGE CONCENTRATION OF SNME (CRIs)
Jul/25 Aug/25 Sep/25 Oct/25 Nov/25 Dec/25 Jan/26 Feb/26 Mar/26 Apr/26 May/26 Jun/26
Portfolio of CRIs, FIIs and Equities — June/2026
CRI PORTFOLIO
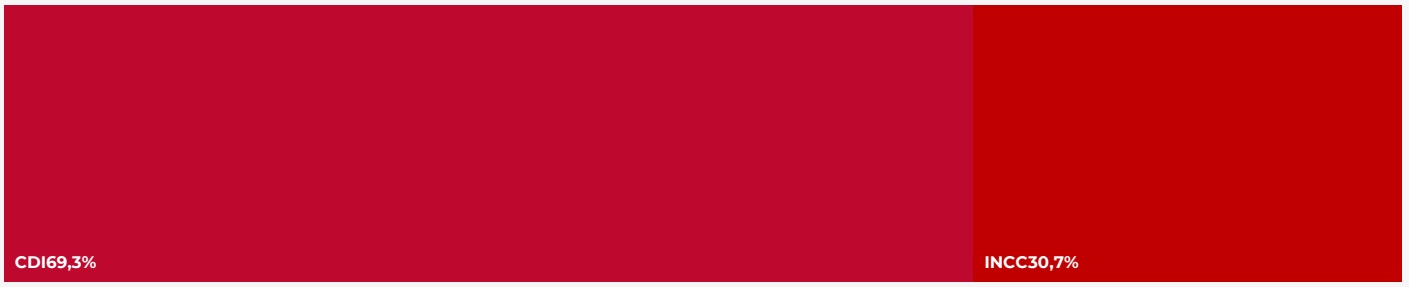
| Asset | Profile | Rating | Index | HTM Yield | % NAV | LTV |
|---|---|---|---|---|---|---|
| CRI VANGUARDA | Granular | D | INCC + 12% | 11.50% | 3.71% | 52% |
| CRI BIT | Granular | A3 | CDI + 6% | 5.50% | 3.64% | 60% |
| CRI BIT Series 2 | Granular | A3 | CDI + 6% | 5.50% | 3.16% | 60% |
| CRI ARPOADOR (SENIOR) | Granular | A1 | CDI + 5% | 4.50% | 1.60% | 43% |
FII PORTFOLIO
| Asset | Sector | % NAV |
|---|---|---|
| Alianza Renda+ | Paper | 13.94% |
| SNEL11 | Energy | 8.00% |
| TRXY11 | Paper | 6.31% |
| SNFZ11 | Agribusiness | 4.25% |
| IBBP11 | Logistics | 4.17% |
| RBRP11 | Corporate Offices | 3.73% |
| IRIM11 | Hybrid | 3.72% |
| CXCO11 | Commercial Offices | 3.32% |
| VRTM11 | Hybrid | 3.02% |
| PCIP11 | Paper | 2.66% |
| TGAR11 | Hybrid | 2.12% |
| MCMV18 | Development | 1.63% |
| INOI11 | Development | 1.56% |
| PSEC11 | Hybrid | 1.55% |
| PATL | Logistics | 0.97% |
EQUITY PORTFOLIO
| Asset | Sector | % NAV |
|---|---|---|
| EZTC3 | Real Estate Dev. | 0.35% |
| ALOS3 | Real Estate Dev. | 0.02% |
| TRIS3 | Real Estate Dev. | 0.03% |
ASSET MON ITORI NG
$$ \textsf { S U N O } \Big ( \textsf { A S S E T } \Big ) $$
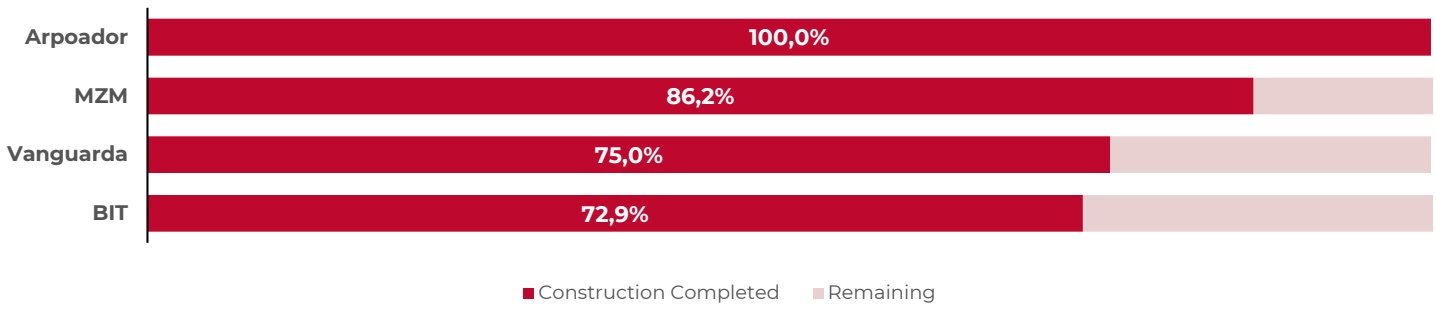
PHYSICAL CONSTRUCTION PROGRESS
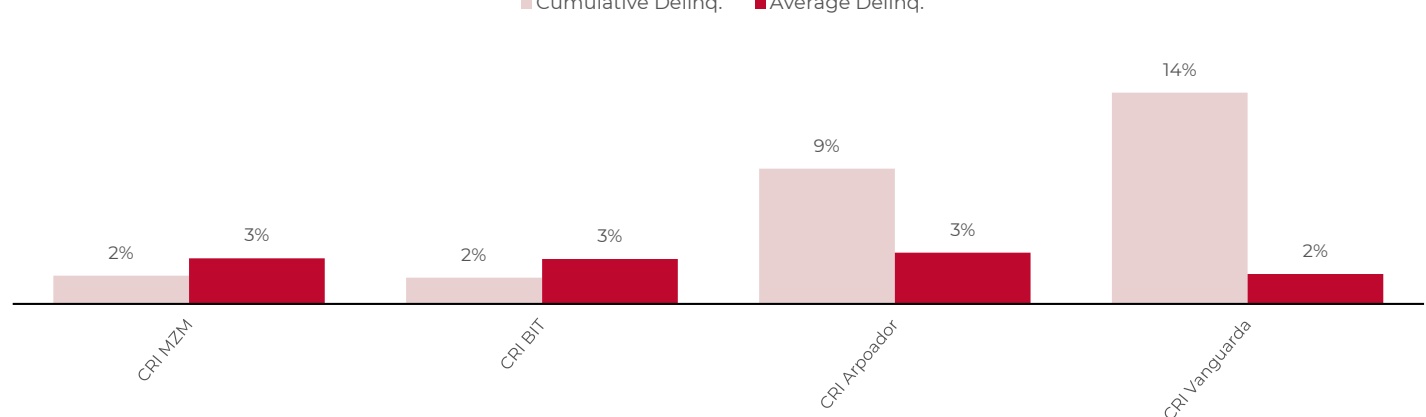
RECEIVABLES PORTFOLIO DELINQUENCY
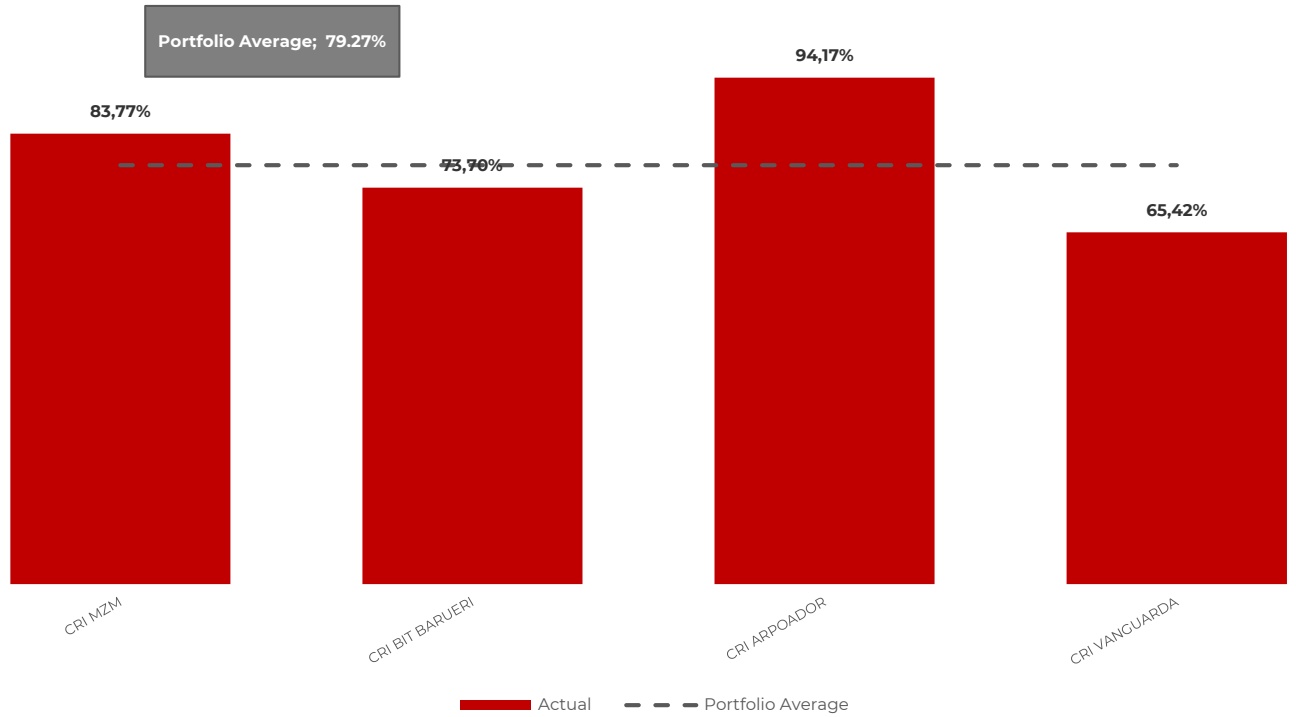
RECEIVABLES PORTFOLIO PROGRESS
ACCOU NTI NG I N FORMATION
R$ 1.90 MM
Total Revenue FIIs + Fixed Income + Equities in the month
R$ 0.2440
Result/Share net result for the month -R$ 0.09 MM
Expenses fees + operating costs
R$ 0.22/share
Distribution Distribution paid on 06/25
R$ 1.81 MM
Net Result R$ 0.2440/share
R$ 0.07 MM
Accumulated Reserve reserve: R$ 0.0669/share
INCOME STATEMENT
| APR/26 | MAY/26 | JUN/26 | R$/Share (M0) | |
|---|---|---|---|---|
| FII Book | R$ 876,673 | R$ 559,800 | R$ 1,737,670 | R$ 0.234 |
| FII Income | R$ 534,038 | R$ 581,347 | R$ 362,103 | R$ 0.049 |
| Capital Gain | R$ 391,352 | -R$ 54,636 | R$ 1,519,355 | R$ 0.205 |
| Capital Gains Tax | -R$ 76,612 | - | -R$ 207,871 | -R$ 0.028 |
| Other Revenue | R$ 27,896 | R$ 33,089 | R$ 64,082 | R$ 0.009 |
| Equity Book | R$ 123,903 | R$ 3,065 | R$ 1,110 | - |
| Dividends and JCP | R$ 1,442 | R$ 3,065 | R$ 1,110 | - |
| Capital Gain | R$ 144,072 | - | - | - |
| Capital Gains Tax | -R$ 21,611 | - | - | - |
| Fixed Income Book | R$ 150,701 | R$ 158,841 | R$ 164,047 | R$ 0.022 |
| Interest | R$ 100,486 | R$ 91,195 | R$ 105,191 | R$ 0.014 |
| Capital Gain | -R$ 1,350 | - | -R$ 2,207 | - |
| Cash | R$ 66,535 | R$ 87,286 | R$ 78,790 | R$ 0.011 |
| Income Tax | -R$ 14,970 | -R$ 19,639 | -R$ 17,728 | -R$ 0.002 |
| Expenses | -R$ 65,548 | -R$ 66,569 | -R$ 92,583 | -R$ 0.012 |
| Administration Fee | -R$ 22,000 | -R$ 22,000 | -R$ 21,999 | -R$ 0.003 |
| Management Fee | -R$ 36,681 | -R$ 36,110 | -R$ 36,631 | -R$ 0.005 |
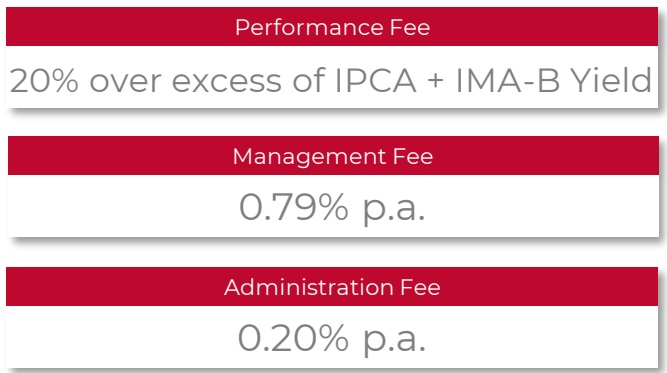
| Performance Fee | - | - | - | - |
| Other Operating Revenue and Expenses | -R$ 6,867 | -R$ 8,459 | -R$ 33,953 | -R$ 0.005 |
| RESULT | R$ 1,085,729 | R$ 655,137 | R$ 1,810,243 | R$ 0.244 |
| Result (R$/Share) | R$ 0.15 | R$ 0.09 | R$ 0.24 | |
| DISTRIBUTION | R$ 741,824 | R$ 1,112,736 | R$ 1,632,013 | |
| DISTRIBUTION (R$/Share) | R$ 0.10 | R$ 0.15 | R$ 0.22 | |
| Accumulated Result (R$/Share) | R$ 0.10 | R$ 0.04 | R$ 0.07 | - |
TOTAL RETU RN 44.13% Since the inception of the fund
ALPHA VS I PCA + I MA-B YI ELD 6.39% Benchmark of the fund
ALPHA VS I FIX 25.14% Main index for FII performance
FUND PERFORMANCE
FUND ALPHA
SNAG11
SNFZ11
SNCI1
SNEL11
▲SNID11
三 SNME11
SNFF11
FIC FIA
SUNO PREV
SUNO GLOBAL EQUITIES
LEARN MORE

IG SUNO ASSET


YT SUNO ASSET
SNME11 - SUNO ASSET WEBSITE

What is SNME11?
A multi-strategy FII by Suno Asset that combines structured real estate credit (CRIs), FII shares and equities, seeking recurring income with inflation protection.
How does the fund generate income?
Interest and monetary adjustment on CRIs (IPCA, CDI, INCC), income from the FIIs held, and occasional capital gains.
Is the income taxed?
For individual investors, income is exempt from income tax under FII legislation. Capital gains on sale are taxed at 20%.
What is the fund's current strategy?
CRIs (weighted HTM yield of 19.24% p.a.) and FIIs (63% of NAV), focused on alpha over IPCA + IMA-B Yield. Average LTV of 55.30%.
What is the merger with SNFF11 and KISU11?
Approved at an AGE, the consolidation of KISU11 and SNFF11 into SNME11 will raise NAV to more than R$ 800 MM. Expected in 2H26.

Where does the fund invest?
In 4 granular CRIs indexed to inflation and to the CDI, plus 25 FIIs and equities from segments such as logistics, paper, hybrid, corporate offices and shopping malls.
Are the shares liquid?
Yes. Traded daily on B3 (ticker: SNME11), with an average daily volume of R$ 415,000 and 8,282 shareholders as of Jun/26.
How does income distribution work?
Monthly payments. In Jun/26, the distribution was R$ 0.22/share, with an annualized DY of 32.00% and a 12-month DY of 16.91%.
What does P/BV mean?
The ratio between the market price and the book value of the share. In Jun/26, the fund traded at 0.98x (market price R$ 9.40 vs. book value R$ 9.63), with no material premium or discount.
Where to access official reports and information?
On the Suno Asset website: suno.com.br/asset/fundos/snme11

Key Brazilian market and regulatory terms for the international investor.
FII (Fundo de Investimento Imobiliário)
Brazilian real-estate investment fund, broadly comparable to a REIT. Listed on B3 and, for individuals, income-tax exempt on monthly distributions.
CRI (Certificado de Recebíveis Imobiliários)
Real-estate receivables certificate: a securitized fixed-income instrument backed by property-related cash flows, similar to a CMBS/ABS note.
Cota / Cotista
Cota = the fund's share/unit; Cotista = the shareholder/unitholder.
P/VP (Preço / Valor Patrimonial)
Price-to-book ratio: market price per share divided by net asset (book) value per share. Above 1.0x = premium, below = discount.
DY (Dividend Yield)
Distributions per share over a period divided by the share price; shown here annualized and on a trailing 12-month basis.
IFIX
B3's benchmark index of listed FIIs — the main reference index for Brazilian real-estate fund performance.
Selic
Brazil's central bank policy interest rate, set by the Copom (the monetary policy committee).
IPCA
Brazil's official consumer price index (broad inflation gauge) published by IBGE.
CDI
Interbank deposit rate; the standard Brazilian floating-rate benchmark, tracking the Selic closely.
INCC
National Construction Cost Index — an inflation index used to adjust development-linked receivables.
IMA-B / NTN-B
IMA-B is an index of IPCA-linked government bonds (NTN-B). “IPCA + IMA-B Yield” is the fund's inflation-plus-real-yield benchmark.
LTV (Loan-to-Value)
Outstanding debt divided by the appraised value of the underlying collateral; lower is more conservative.
HTM (Held-to-Maturity)
Yield expected if a CRI is held to maturity, as opposed to a mark-to-market yield.
Duration
Weighted-average time to receive a portfolio's cash flows; a measure of interest-rate sensitivity.
Alpha vs Benchmark
Excess return generated above the fund's reference benchmark (IPCA + IMA-B Yield, and the IFIX).
AGE / Edital
AGE = Extraordinary General Meeting of shareholders; Edital = the official convening notice / call document.
JCP
Interest on equity (juros sobre capital próprio) — a Brazilian shareholder-remuneration mechanism distinct from dividends.
Gestora / Administrador
Gestora = investment manager (Suno); Administrador = the administrator/fiduciary responsible for the fund's operation (BTG Pactual).
NOTICES AN D DISCLAI M ERS
This document is a free English translation of the management report (Relatório Gerencial) of Suno Multiestratégia FII (SNME11), prepared solely for the convenience of readers who do not read Portuguese. The Portuguese version is the sole official version, is the one filed with the Brazilian Securities and Exchange Commission (Comissão de Valores Mobiliários – CVM) and disclosed under applicable Brazilian regulation and ANBIMA self-regulation, and prevails over this translation in the event of any divergence, omission or doubt as to interpretation. It does not replace or amend the Portuguese version, the Fund's bylaws (regulamento) or any other document of the Fund.
All figures refer to the same reference date as the Portuguese version and are stated in Brazilian reais (R$), the Fund's functional currency, in which its assets, liabilities and results are recorded and reported to CVM and ANBIMA. Suno Asset assumes no obligation to update this translation.
This document is informational only and does not constitute an offer, solicitation, advertisement or recommendation to buy, sell or subscribe for any security, nor legal, tax or investment advice. SNME11 is a Brazilian real estate investment fund (Fundo de Investimento Imobiliário – FII), regulated and supervised by CVM, registered for public distribution and admitted to trading exclusively in Brazil, on B3 S.A. – Brasil, Bolsa, Balcão. It is not registered for offer or distribution in any other jurisdiction.
This document is not directed at any person in any jurisdiction where its distribution or use would be contrary to applicable law or would require any registration or authorisation not already obtained. Readers access it on their own initiative and are responsible for observing the rules applicable in their own jurisdiction, including tax and exchange control rules.
Estimates, projections and distribution guidance herein reflect the current judgement of Suno Asset as at the date of disclosure and are subject to change without notice. They are not free from error, offer no assurance that the scenarios described will occur, and do not constitute a promise or guarantee of return, of any future distribution or of capital preservation.
Investment funds are not guaranteed by the fund's administrator, by the portfolio manager, by any insurance mechanism or by the Brazilian credit guarantee fund (Fundo Garantidor de Créditos in Portuguese, or “FGC”). Past performance is not a guarantee of future results. Investors are advised to carefully read the Fund's prospectus and bylaws (regulamento) before investing. Investors must be prepared to accept the risks inherent to the various markets in which investment funds operate and, consequently, possible fluctuations in the invested capital. The Administrator is not liable for any errors or omissions in this material, nor for the use of the information contained herein. In addition, the Administrator is not liable for investors' decisions regarding the matters addressed in this material, nor for the acts or facts of professionals and specialists consulted by the investor.
This material does not relate to the specific investment objectives, financial situation or particular needs of any specific recipient and should not be relied upon as the sole source of information in the investor's decision-making process. Before deciding, the investor should carry out — preferably with the assistance of a duly qualified professional — a careful assessment of the product and its respective risks against his or her personal objectives and risk tolerance (suitability). The Portuguese version of this report and the Fund's other official documents are available at suno.com.br/asset/fundos/snme11.