
Relatório gerencial em inglês TEPP11 de agosto de 2026
Relatório gerencial em inglês do Tellus Properties (TEPP11), fundo imobiliário de tijolo, referente a agosto de 2026, com entrega no FundosNet (B3) em 02/10/2026. No pregão de 03/11/2026, a cota do TEPP11 fechou a R$ 6,65, com P/VP de 0,70 (valor patrimonial de R$ 9,53 por cota no informe mensal de setembro de 2026). O último rendimento foi de R$ 0,068 por cota, com pagamento em nov/2026, e o dividend yield dos últimos 12 meses é de 17,40% sobre a cotação de 03/11/2026. O patrimônio líquido era de R$ 512,3 milhões no informe mensal de setembro de 2026. Os indicadores são os mais recentes da base do Kartac, não os do período do documento.
Informações
- Fundo
- TELLUS PROPERTIES RESPONSABILIDADE LIMITADA-10,74%
- CNPJ
- 26.681.370/0001-25
- Tipo
- Outras Informações
- Assunto
- Relatório gerencial em inglês
- Data de referência
- 31/08/2026
- Data de entrega
- 02/10/2026 11:18
- Versão
- 1
- Situação
- (Ativo)
Conteúdo
TELLUS PROPERTIES FII TEPP11
MONTHLY MANAGEMENT REPORT August | 2026
TABLE OF CONTENTS
- FUND PERFORMANCE 3
- MANAGER’S LETTER 4
- DISTRIBUTION PROJECTIONS 5
- PORTFOLIO 6
- FINANCIAL STATEMENTS 9
- PROJECTED CASH FLOW 10
- PORTFOLIO – CONSOLIDATED OVERVIEW 11
- PORTFOLIO – OPERATIONAL INDICATORS 12
- SECUNDARY MARKET 15
- PERFORMANCE 16
- TIMELINE – ACQUISITIONS AND DISPOSALS 18
- THE MANAGER 19

TELLUS PROPERTIES FII
FUND CHARACTERISTICS
TICKER
TEPP11
MANAGEMENT
Tellus Investimentos e Consultoria Ltda.
ADMINISTRATOR
BTG Pactual Serviços Financeiros S.A. Distribuidora de Títulos e Valores Mobiliários.
ABOUT THE FUND
CNPJ
26.681.370/0001-25
AUDITOR
Ernest & Young Auditores Independentes
TRADING START DATE ON B4
26/09/2019
MANAGEMENT FEE
0,90% a 1% a.a.
ADMINISTRATION FEE
0,13% a.a.
TAX
In accordance with the Fund’s by laws, offering
memorandum, and laws nº. 8,668/93 and nº.
9,779/1999.
TEPP11 is an office-focused real estate fund dedicated to acquiring well-located properties with transformation and valueadd potential. The transformation process involves assessing each building’s potential, taking into account factors such as average rental levels, services offered to tenants, accessibility, and improvements that may enhance the asset’s value, ultimately driving revenue growth for the Fund. This process is led by Management, which carefully evaluates costs, timelines, and implementation stages of the proposed improvements, often involving refurbishment works. Management is committed to providing transparency throughout the process, regularly reporting on the progress of each initiative.
GENERAL INDICATORS
Net Asset Value
Fund Market Capitalization
Dividend Yield (Monthly)
BRL 504,964,580.05
P/B
BRL 413,980,420.70
0.88%
0.82
Net Asset Value per Share
Market Share Price
Dividend Yield (Annualized)
BRL 9.39
BRL 7.70
20.53%
ADTV (30 days)
BRL 1,196,577
OPERATING INDICATORS
Number of Assets
Leasable Area ( per sqm)
Physical Vacancy
Number of Shareholders
7
57,846
10.96%
45,660
Number of Tenants
WAULT (Years)
Financial Vacancy
Asset Value ( per sqm)
48
4.07%
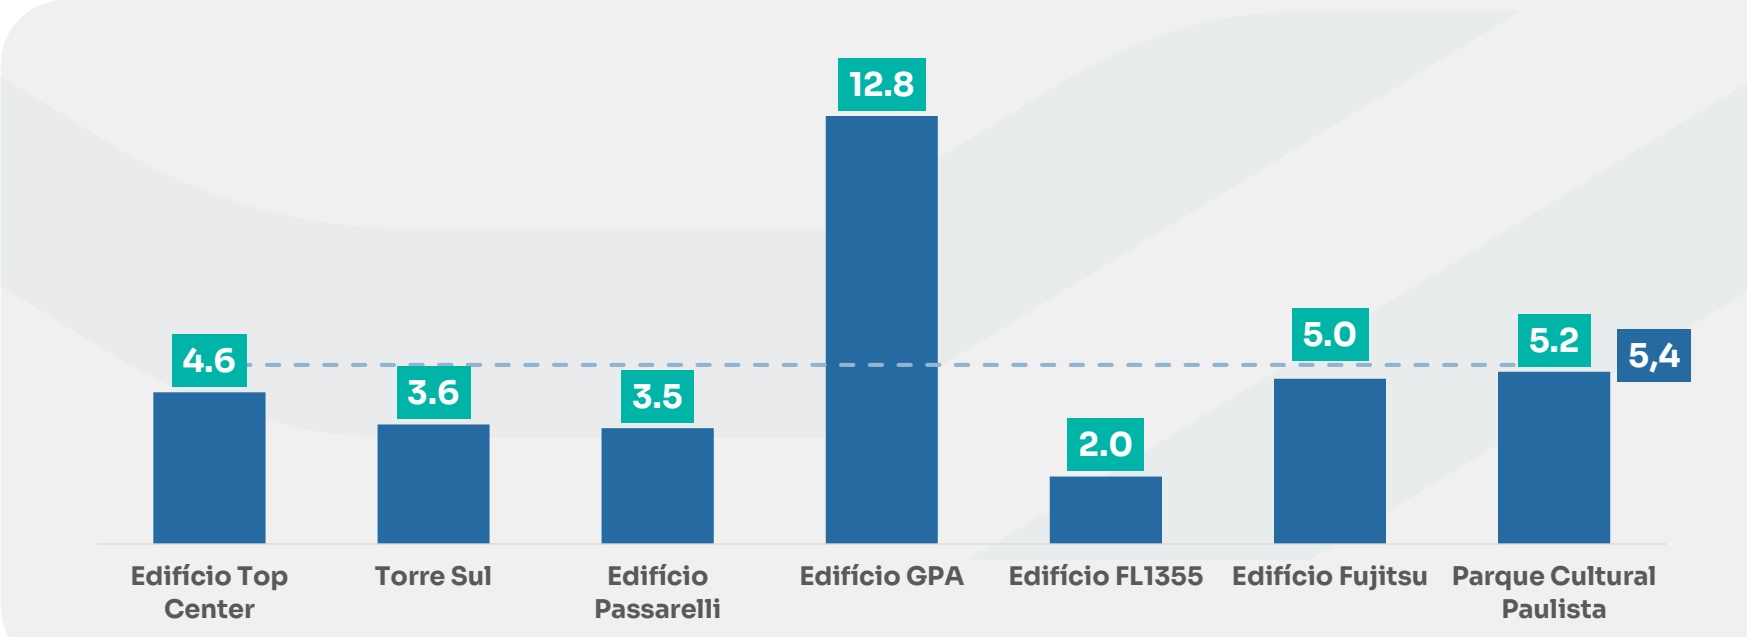
5.37
BRL 9,501
Watch Management’s report presentation on YouTube channel , YouTube channel or listen on Spotify. TEPP11's new website
MARKET OVERVIEW
Global markets remained highly volatile in August, as investors reassessed the trajectory of interest rates in the United States amid persistent inflation signals. Following the July decision — in which the Federal Reserve held rates in the 3.50%–3.75% range despite dissenting votes in favor of a hike — the Jackson Hole speech reinforced the perception that the monetary authority might still have "work to do" should inflation fail to converge toward its target. Meanwhile, Chinese economic activity continued to send mixed signals, while a fresh escalation of tensions in the Middle East put renewed upward pressure on oil prices toward month-end, keeping the external environment selective for risk assets.
In Brazil, the IPCA recorded deflation of 0.32% in August, compared with a 0.07% rise in July, bringing the 12-month reading to 4.22% — below the 4.44% seen the previous month. The result was driven mainly by declines in electricity, food, and transportation prices, reinforcing the improvement in current inflation trends. On the monetary policy front, the Copom extended its easing cycle and cut the Selic rate by 25 basis points to 14.00% per annum, while maintaining a cautious tone given that inflation expectations remain above the midpoint of the target and uncertainties persist in the external environment.
In terms of domestic asset performance, the Ibovespa closed August down 0.32% at 177,419 points, following significant volatility throughout the month and meaningful foreign capital outflows through mid-month. In the currency market, the spot dollar advanced roughly 2.24%, closing at BRL 5.1814, reflecting heightened domestic risk aversion and swings in the external backdrop. Finally, the IFIX — the main real estate investment fund index — ended August at 3,762.79 points, down 1.46% for the period, marking the fourth consecutive month of negative performance for the index.
FUND HIGHLIGHTS
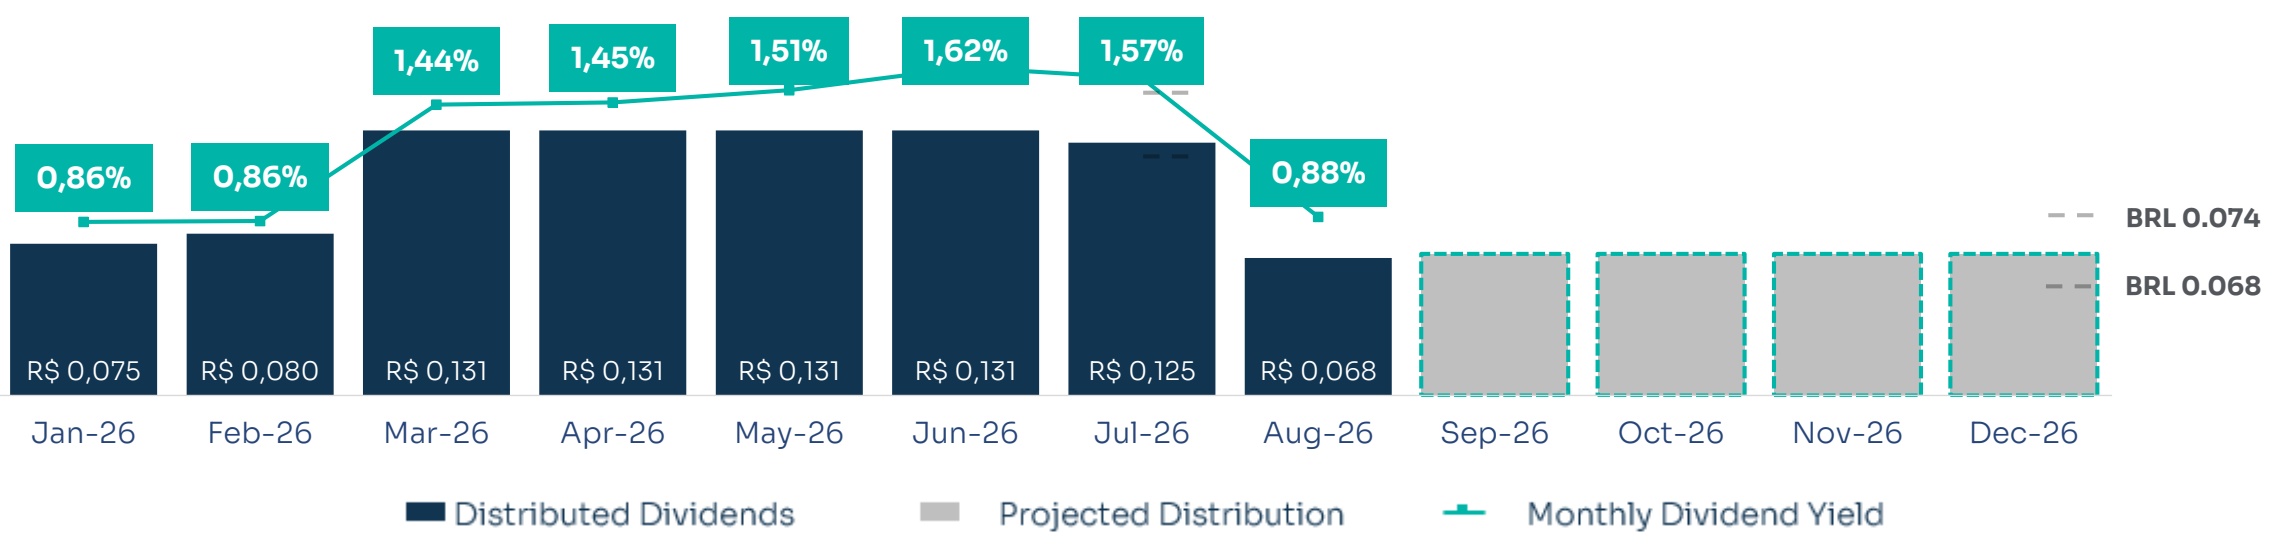
The Fund closed August with its share price valued at BRL 7.70 and distributed BRL 0.068 per share, representing a monthly Dividend Yield of 0.88% (equivalent to 11.13% annualized).
The month was highlighted by the closing of the Fund's 5th (fifth) issuance of its Single Share Class, with total proceeds of BRL 40,265,117.28 (forty million, two hundred and sixtyfive thousand, one hundred and seventeen reais and twenty-eight centavos). The funds were allocated to the acquisition of a floor at Ed. Torre Sul, units 43, 44, 45, 61, 62, and 66 at Ed. Passarelli, and commercial units 41 and 42 at Ed. Parque Cultural Paulista.
The main operational highlight of the month was the completion of the rent review at Ed. Brigadeiro Faria Lima, with a 44% increase. Additionally, visits to Ed. Fujitsu intensified throughout the month, and the four currently vacant floors are in the letter of intent phase, pointing to a good outlook for eliminating vacancy at the property.
Regarding the divestment process for Ed. Passarelli, the closing of the transaction is estimated to occur by the end of September, subject to the completion of the final steps of the deal.
_ DIVIDEND YIELD AND DISTRIBUTION PER SHARE
PERFORMANCE
¹ Assumed tax rate of 15% ² Dividends based on August /2026
Dividend² per Share BRL 0.068 per share for the month
Distribution Equivalent to 94,78% of net CDI¹
Dividend Yield 0.88% p.m. or 11.13% p.y. based on month-end share price
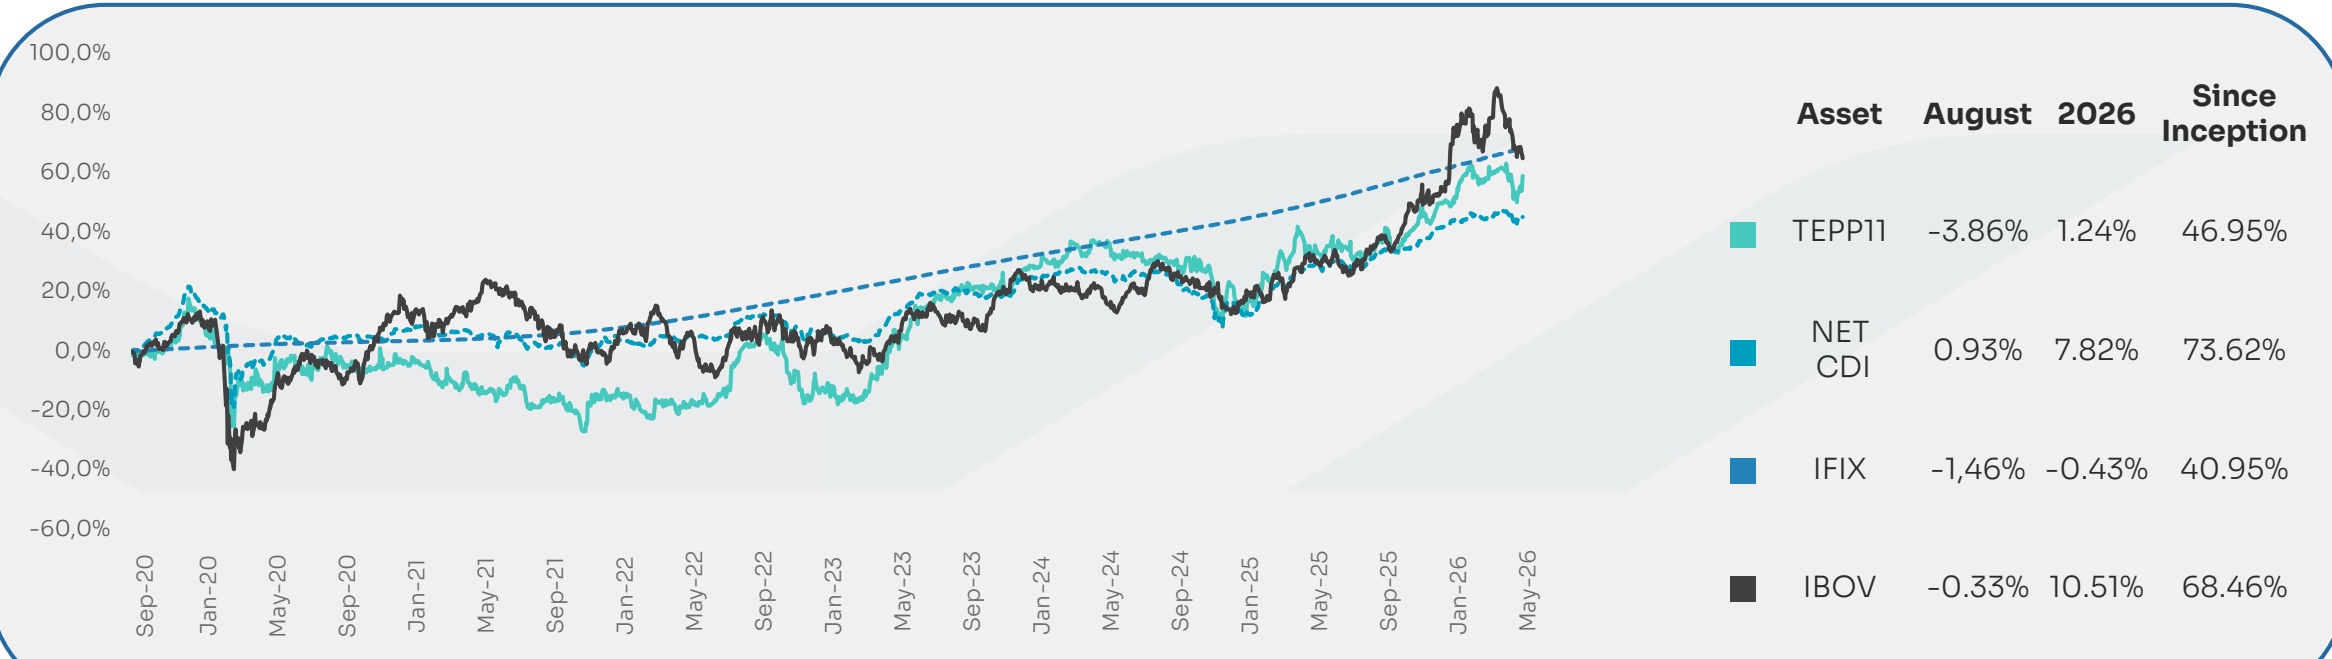
| ASSET | % IFIX | P/B | ANNUALIZED DIVIDEND YIELD ² |
|---|---|---|---|
| FII 1 | 0.34% | 0.83 | 12.08% |
| TEPP11 | 0.27% | 0.80 | 10.81% |
| FII 2 | 0.92% | 0.80 | 8.71% |
| FII 3 | 0.62% | 0.76 | 13.98% |
| FII 4 | 0.32% | 0.68 | 11.93% |
| FII 5 | 1.26% | 0.66 | 6.39% |
| FII 6 | 0.20% | 0.63 | 15.50% |
| FII 7 | 0.12% | 0.61 | 17.05% |
| FII 8 | 0.41% | 0.60 | 11.25% |
| FII 9 | 0.84% | 0.59 | 9.95% |
| FII 10 | 0.76% | 0.53 | 11.52% |
| FII 11 | 0.24% | 0.43 | 11.83% |
| MÉDIA³ | 6.29% | 0,65 | 10.42% |
Source: Broadcast
The distribution projection disclosed does not constitute a promise or guarantee of returns. It is an estimate based on Management’s current assumptions and may be revised at any time in light of new facts, events, or changes in market conditions. ² Value weighted by Net Asset Value
ED. TORRE SUL
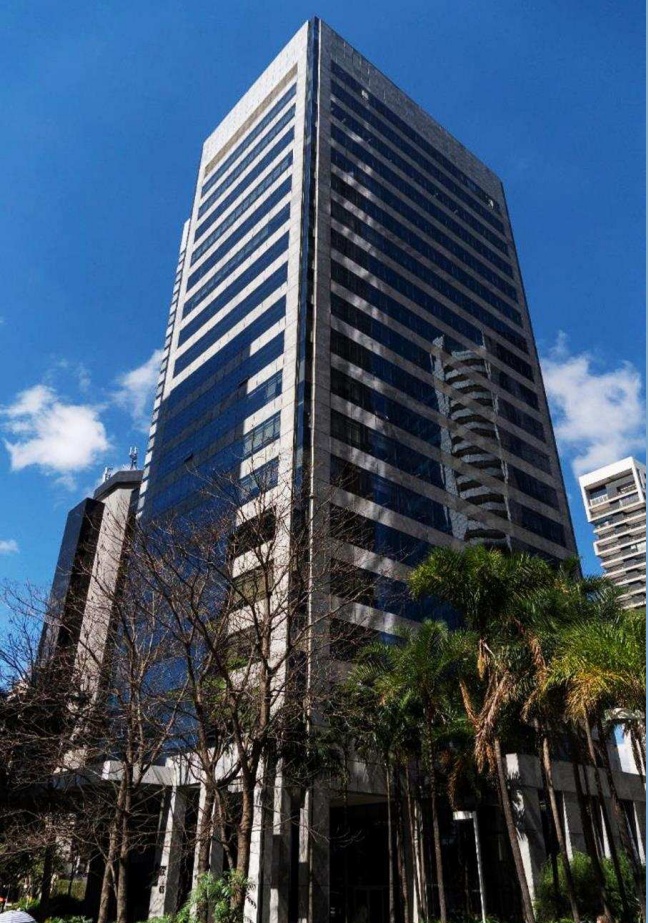
Location: R. James Joule, 65 | Berrini% Ownership: 49.5% Leasable Area (sqm): 9,950 LEED Certification: Platinum Classification: A

Torre Sul is a Class A office building located in the Berrini submarket of São Paulo, integrated into the Centro Empresarial Nações Unidas (CENU) complex. Delivered in 2004, the property comprises 16 typical office floors, with floor plates ranging from approximately 865 sqm to 1,081 sqm of Gross Leasable Area (GLA).The building features five underground parking levels, central air conditioning, raised flooring, modular suspended ceilings, building automation systems, and a full-capacity backup generator serving 100% of the property. It offers a clear ceiling height of 2.80 meters and complementary infrastructure including an auditorium, a fully operational helipad, and 24-hour security systems. Additionally, the property is located approximately 800 meters from Berrini Station
PORTFOLIO UPDATE
At Ed. Torre Sul, as mentioned in the previous month, Management and the property manager have established strategies for the commencement of helipad operations.
Studies for the modernization of the building's air conditioning system and elevators remain ongoing.
ED. PASSARELLI
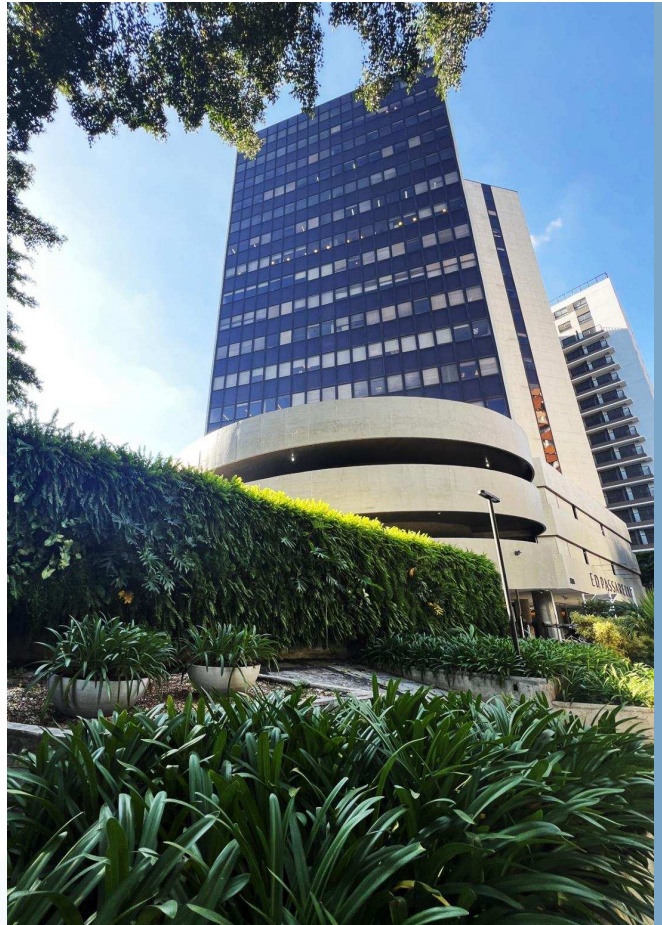
Location: R. Paes Leme, 524 | Pinheiros% Ownership: 52.8% Leasable Area (sqm): 7,130 LEED Certification: Platinum Classification: B
Delivered in 1980, Edifício Passarelli is a Class B office building located in the Pinheiros submarket of São Paulo. The property comprises 17 floors, with typical floor plates of approximately 1,019 sqm of Gross Leasable Area (GLA) per floor, subdivided into six office suites. The building features central air conditioning, building automation systems, a backup generator serving the common areas, and LEED Platinum certification. It also includes one underground parking level, ground-level parking, and three upper parking levels. The asset is situated in a well-established office district, with direct access to Pinheiros Station (CPTM/Metro) and close proximity to the Faria Lima and Marginal Pinheiros corridors.

PORTFOLIO UPDATE
Regarding the sale of the property, Management and the potential buyer continue to discuss the final terms of the transaction documents. The expectation is that the agreements will be executed by the end of September, provided that the conditions precedent established between the parties are met.
ED. FUJITSU
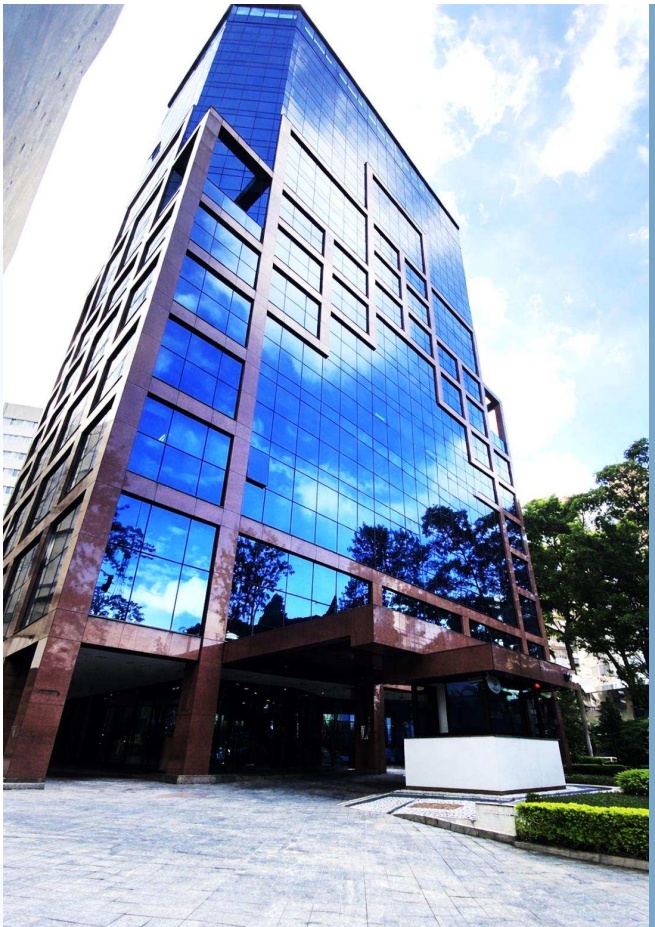
Location: R. Treze de Maio, 1633 | Paulista% Ownership: 52% Leasable Area (sqm): 4,985 LEED Certification: Gold Classification: B

Developed in 1994, Edifício Fujitsu is a Class B office building located in the Paulista submarket of São Paulo. The property comprises 14 floors, with typical floor plates of approximately 681 sqm of Gross Leasable Area (GLA).
The building features central air conditioning, raised flooring, a clear ceiling height of 2.60 meters, a backup generator serving the common areas, and LEED Gold certification.
The asset is located near Brigadeiro and Vergueiro metro stations, close to Shopping Pátio Paulista, and offers convenient access to Paulista, 23 de Maio, Bernardino de Campos, and 9 de Julho avenues.
PORTFOLIO UPDATE
During the month, Management initiated discussions with the building's other owners to align on the planned upcoming improvements to the asset, including the removal of the external security railings, expansion of the building's vehicle entrance, replacement of the parking operator, retrofit of the common area on the top floor, implementation of a café on the ground floor, and rebranding of the building's name.
Regarding the leasing of vacant floors on the 1st, 5th, 6th, and 7th floors, a recovery in demand was noted, with strong interest in the spaces during the second half of the year. Several leasing proposals were received throughout the month and are currently under review and in the letter of intent stage by Management. Should these proposals progress, there is a prospect of full occupancy being achieved at the asset.
ED. BRIGADEIRO FARIA LIMA (BFL)
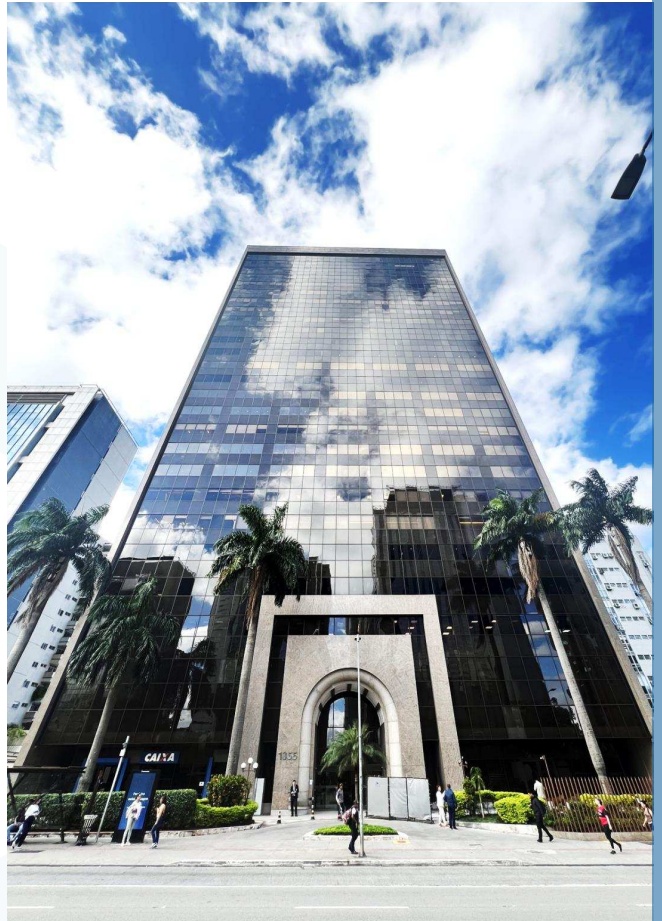
Location: Av. Brigadeiro Faria Lima, 1355 | Faria Lima% Ownership: 25.7% Leasable Area (sqm): 5,761 LEED Certification: In process Classification: B
Edifício Brigadeiro Faria Lima is a Class B office building located in the Faria Lima submarket of São Paulo. Developed in 1986, the property comprises 23 floors, with typical floor plates of approximately 951 sqm of Gross Leasable Area (GLA).
The building features central air conditioning, raised flooring, a clear ceiling height of 2.65 meters, and a full-capacity backup generator serving 100% of the property. It is currently undergoing the LEED certification process.
Located just a few meters from Eldorado and Iguatemi shopping centers, the building is approximately 350 meters from Faria Lima metro station and offers convenient access to Rebouças Avenue and Marginal Pinheiros.
PORTFOLIO UPDATE
At Ed. BFL, negotiations with one of the tenants for a rent review have been concluded, resulting in a 44% increase over the current rent, effective retroactively from March.
Regarding improvements, retrofit studies are ongoing. Certain complementary projects have been commissioned and are currently underway, including those related to fire suppression systems and structural works. The submission of the permit application to the city hall is estimated to take place by the end of this year.
_ ED. GPA
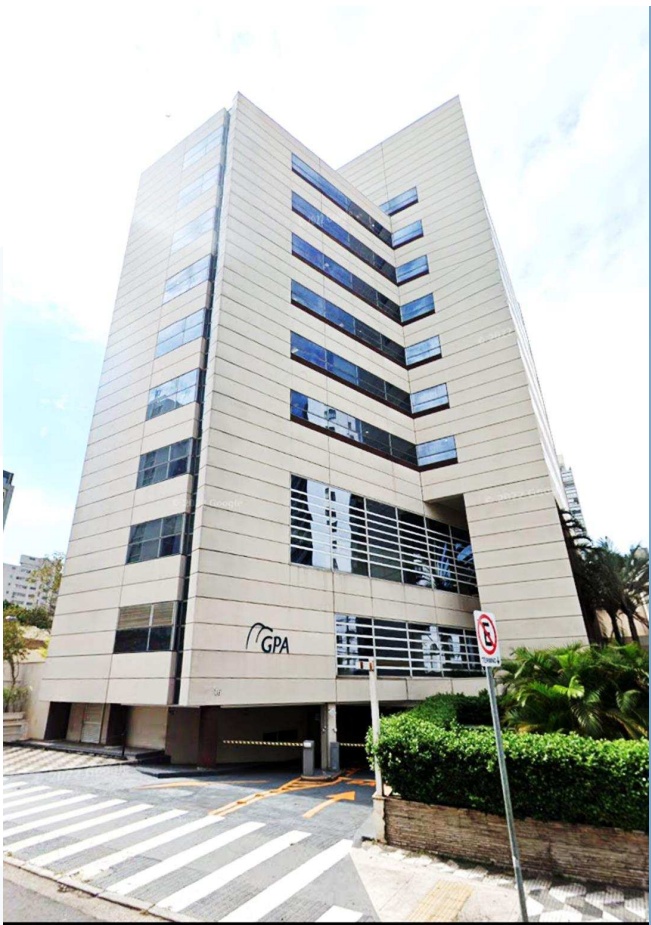
Location: Av. Brigadeiro Luís Antônio, 3172 | Jardins% Ownership: 100% Leasable Area (sqm): 11,224 LEED Certification: Not Certified Classification: B
Ed. GPA is a Class B, single-tenant office building constructed in the 1990s. The asset is located on one of São Paulo’s main thoroughfares, at the intersection of Avenida Brigadeiro Luís Antônio and Alameda Lorena.
The property benefits from a wide range of public transportation options, being approximately 900 meters from Brigadeiro metro station, and offers convenient access to the city’s main avenues.
The building is situated in Jardim Paulista, one of São Paulo’s most prestigious and traditional neighborhoods. The headquarters is located next to the first Pão de Açúcar store, inaugurated in 1959, a landmark of historical relevance to the area.
PORTFOLIO UPDATE
No significant updates were provided for the asset during the month.
ED. TOP CENTER
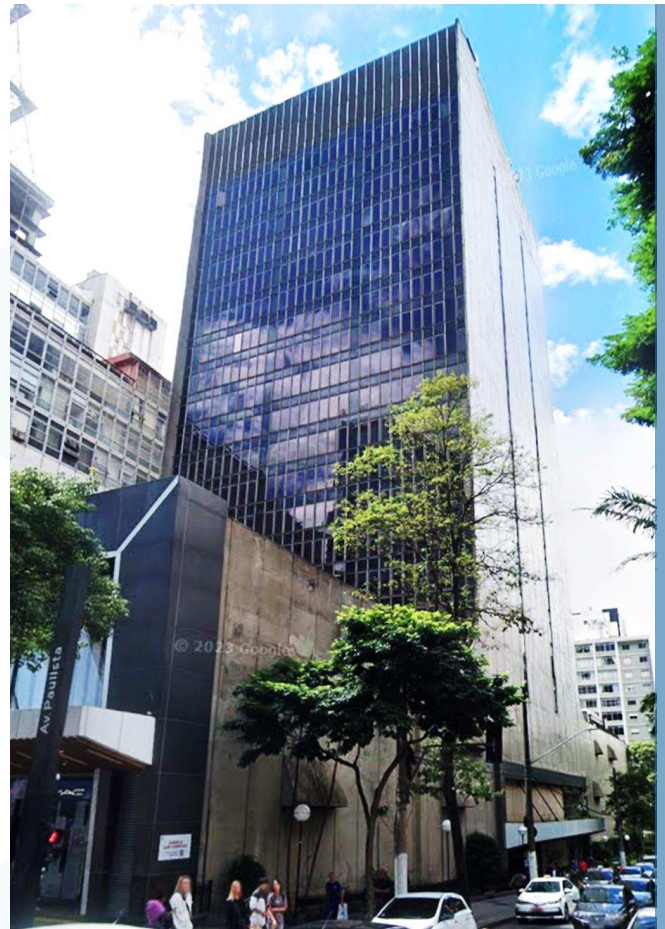
Location: Av. Paulista, 854 | Paulista% Ownership: 100% Leasable Area (sqm): 13,463 LEED Certification: Not Certified Classification: B
Top Center is a mixed-use complex comprising a Commercial Tower integrated with a shopping center, as well as a standalone parking structure serving the entire development.
The Commercial Tower features 17 floors, with typical floor plates of approximately 792 sqm, allowing for multiple occupancy configurations and accommodating different tenant profiles.
Located between Avenida Paulista, Alameda Joaquim Eugênio de Lima, and Rua São Carlos do Pinhal, Top Center occupies a 3,948 sqm site and is close to key urban mobility hubs: approximately 500 meters from Brigadeiro station, 400 meters from Trianon-Masp station, and 1,300 meters from Consolação station.
PORTFOLIO UPDATE
At Ed. Top Center, Management continues to oversee, together with the property management company, the implementation of the necessary improvements to the asset.
In this context, the following workstreams have already been initiated: renovation of the waste disposal areas; full retrofit of the three basement levels, encompassing floor scarification and leveling, application of epoxy coating, and new floor markings; painting of floors, walls, and columns across the basement levels and ground floor; and full retrofit of the basement's electrical infrastructure.
On the commercial front, leasing proposals have been received, and negotiations for renewals and revisions of existing contracts are ongoing, reinforcing Management's efforts to preserve and potentially increase the asset's rental income.
ED. PARQUE CULTURAL PAULISTA GPA
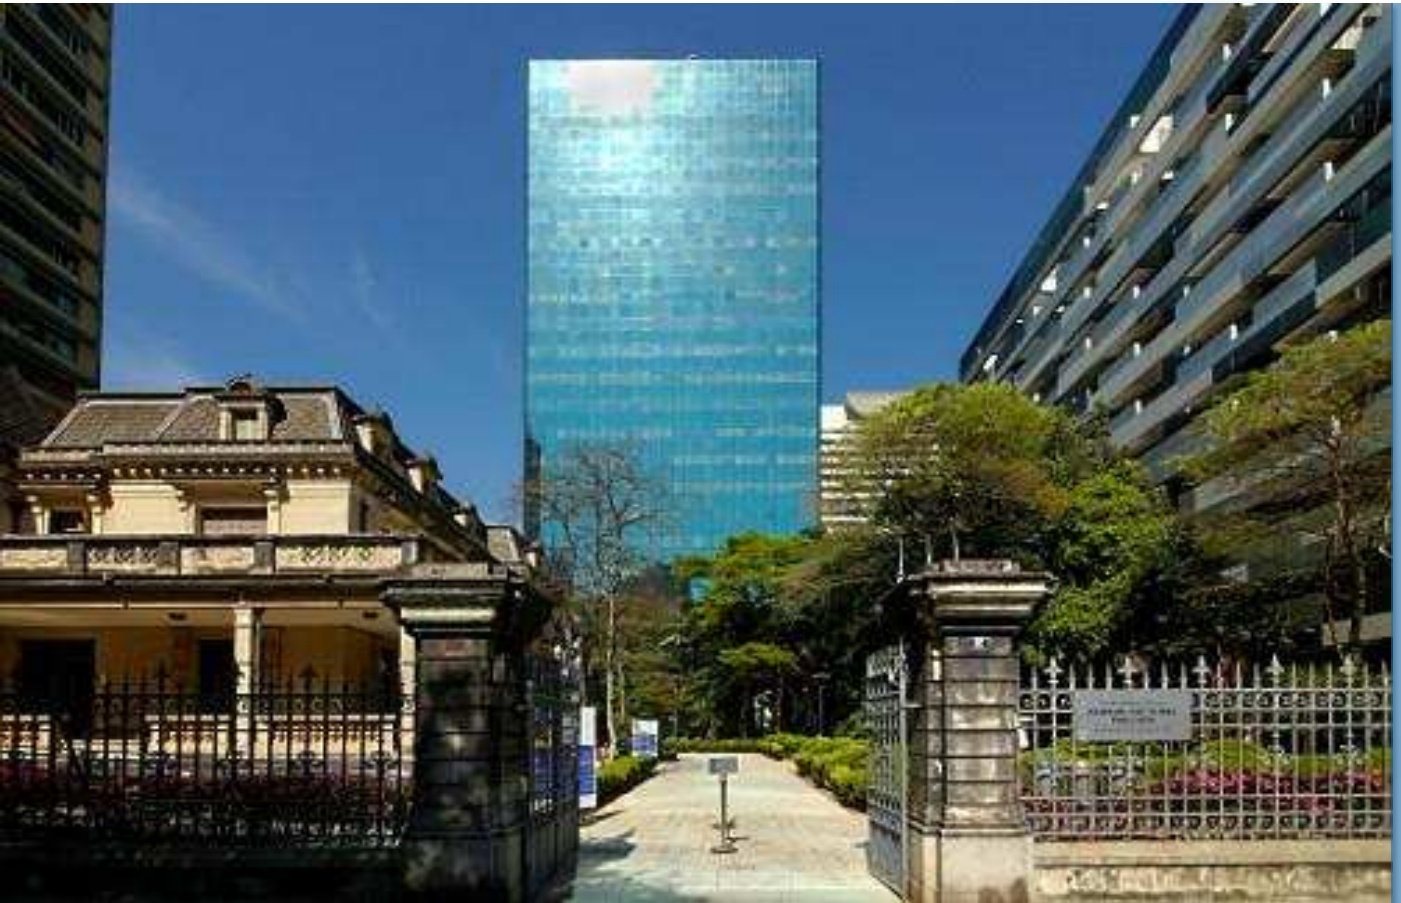
% Ownership: 5%
ABOUT THE ASSET
Leasable Area (sqm): 1,118 m²
Classification: B
LEED Certification: Not Certified
Location: Av. Paulista, 37 | Bela Vista
Built in 1990, Edifício Parque Cultural Paulista is a commercial office building with 20 floors, floor plates of approximately 1,118 m² (BOMA) and a land area of 5,500 m², located between Avenida Paulista and Alameda Santos. The transaction involves the acquisition of 11 units, equivalent to 6,152 m² and 27.5% of the building's total area, making TEPP11 the largest individual owner in an asset with a fragmented ownership structure.
AQUISITION INDICATORS
Parque Cultural stands out within its competitive set: over the past four years, it has maintained a minimum occupancy rate of 93%, reaching 100% in more recent quarters. With only 8 Class B assets on Avenida Paulista offering floor plates above 1,000 m² and vacancy below 1% among Class A/A+ buildings, the scarcity of quality supply underpins the structural demand for the asset.
Avenida Paulista is undergoing an appreciation cycle driven by the migration of companies from Faria Lima seeking high-visibility addresses with a more balanced occupancy cost. This trend is reinforced by the return to in-person work, which favors areas with strong accessibility: Avenida Paulista is served by 4 stations across 2 metro lines, bus corridors, and dedicated cycling lanes. Parque Cultural is 260 meters from Brigadeiro station and in close proximity to other assets managed by Tellus along the same corridor.

Purchase Price
BRL 15,939,114.06

Entry Cap Rate
9.6 %

Rent (BRL/m²)
113.46

Boma Area
1,118.56 m²
| Jul/26 | Jul/26 | 2S26 | YTD | LTM | |
|---|---|---|---|---|---|
| Lease Income | (BRL/share)0.098 | (BRL '000)4,863 | (BRL '000)4,863 | (BRL '000)31,742 | (BRL '000)48,461 |
| GuaranteedIncome | - | - | - | - | - |
| Financial Income | 0.001 | 49 | 49 | 1,939 | 2,806 |
| Other Income | - | 12 | 12 | 18,396 | 20,232 |
| Total Revenues | 0.099 | 4,923 | 4,923 | 52,077 | 71,499 |
|---|---|---|---|---|---|
| Property Expenses | (0.014) | (698) | (698) | (3,177) | (3,340) |
| Financial Expenses | (0.015) | (737) | (737) | (4,607) | (8,205) |
| OperatingExpenses | (0.004) | (185) | (185) | (696) | (1,189) |
| Management, AdministrationandCustodyFee | (0.007) | (361) | (361) | (2,759) | (4,348) |
| Total Expenses | (0.040) | (1,980) | (1,980) | (11,240) | (17,082) |
| Net Income | 0.059 | 2,943 | 2,943 | 40,837 | 55,630 |
|---|---|---|---|---|---|
| BegginingofUndistributedEarnings | 0.048 | 2,360 | 2,360 | 637 | 7,875 |
| Net Income for thePeriod | 0.059 | 2,943 | 2,943 | 40,837 | 55,630 |
| Total Result-DividendsDeclared | (0.068) | (3,374) | (3,374) | (39,545) | (55,805) |
| EndofUndistributedEarnings | 0.039 | 1,929 | 1,929 | 1,929 | 1,929 |
FUND NET ASSET VALUE COMPOSITION
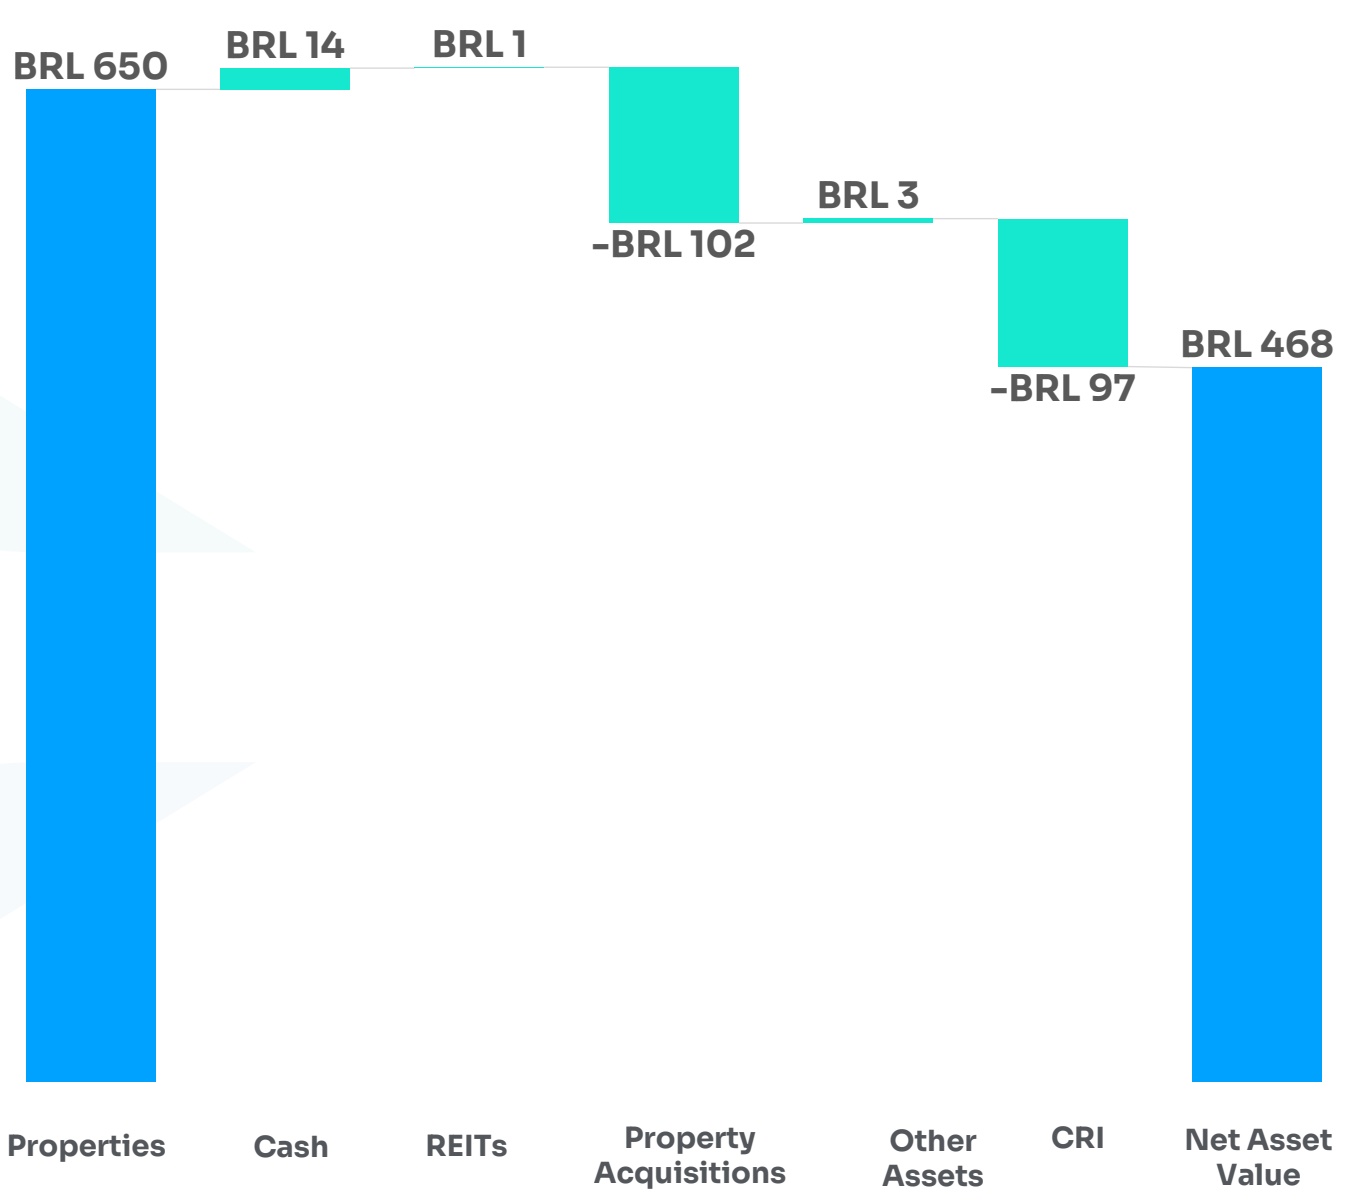
¹ Portfolio composition as of 05/30/2026
CLICK HERE TO ACCESS TEPP11’S FUNDAMENTALS DATA SHEET
ACQUISITIONS AND DISPOSALS
| Asset | Transaction Type | Amount (BRL MM) | Payment Method | Date |
|---|---|---|---|---|
| Ed. Brigadeiro Faria Lima | Acquisition | -2.5 | Cash | Sep-26 |
| Ed. Brigadeiro Faria Lima | Acquisition | -1.3 | Cash | Mar-27 |
| Ed. Top Center | Acquisition | -62.2 | Share | Jul-27 |
| Ed. Brigadeiro Faria Lima | Acquisition | -3.8 | Cash | Sep-27 |
| Ed. Top Center | Acquisition | -29.5 | Cash | Dec-27 |
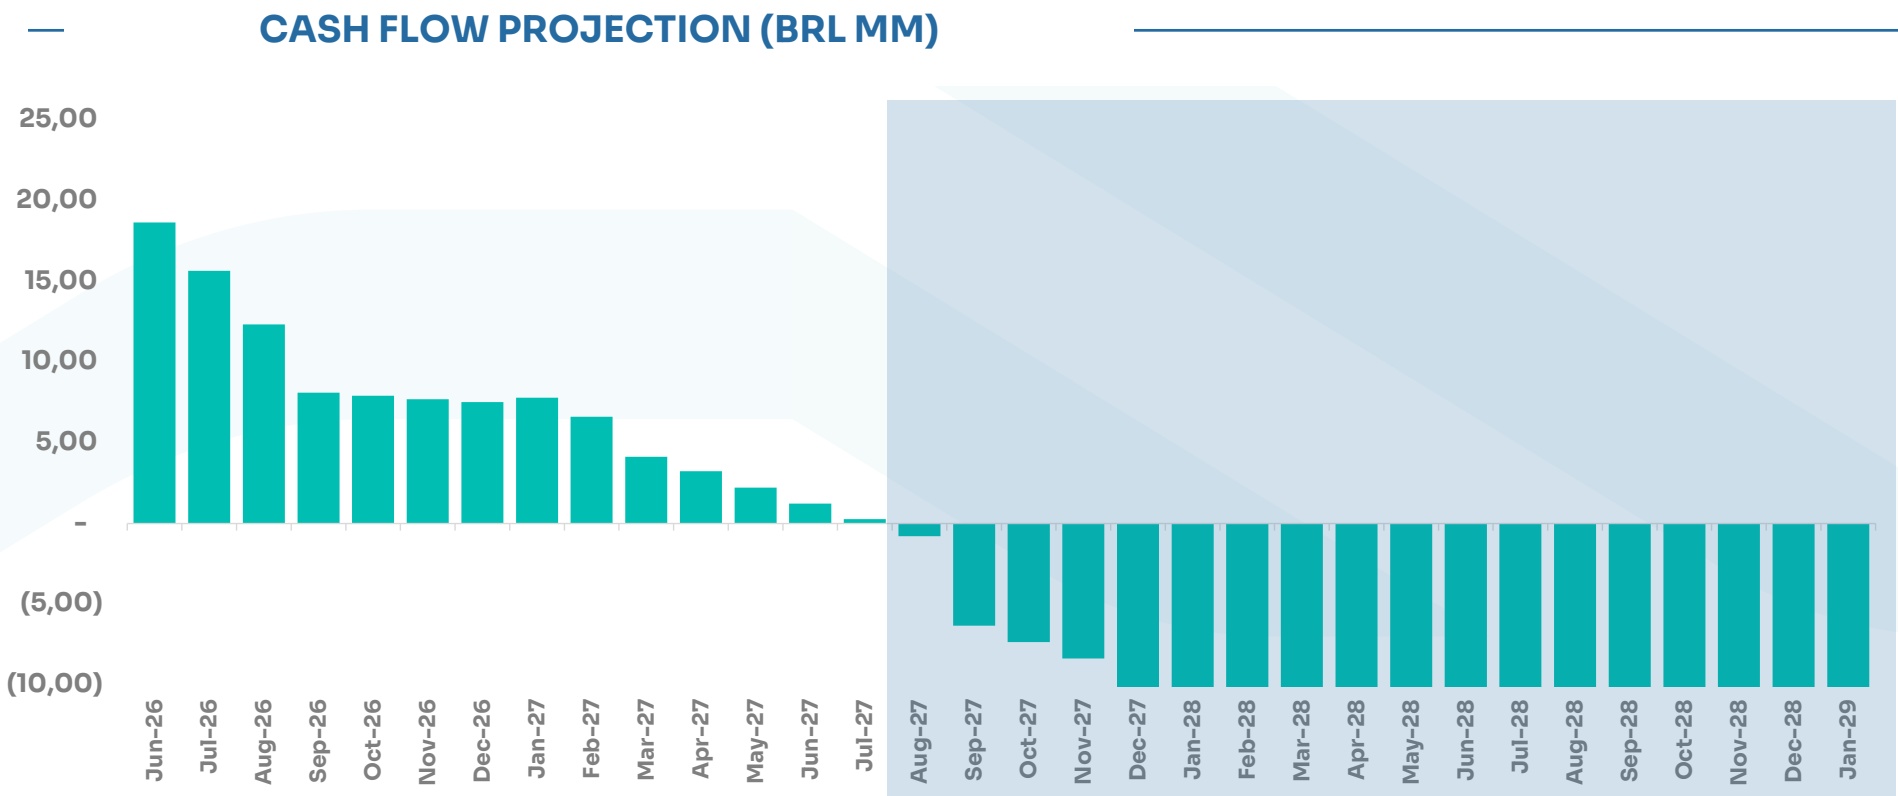
Projections indicate that the Fund has sufficient financial capacity to fully meet its obligations through August 2027, without the need for new unit issuances or asset divestments. During this period, Management continues to evaluate the execution of a new issuance aimed at expanding the Fund's asset base, enabling capital raising at a more opportune moment. Additionally, a portion of the portfolio assets has already reached a maturation stage, which may enable strategic divestments with cash generation for the Fund.
Management highlights that the variations observed in the cash flow are a result of updated assumptions, revised income projections, and adjustments to the projected balances of the Fund's liabilities. It is further noted that the figures presented refer exclusively to the net cash position, excluding illiquid assets such as real estate investment fund units. Finally, projections may be adjusted over time as new strategies are adopted, or material events occur.
¹Cash inflows already reflect the net capital gain amount. Future contractual adjustments to receivables and payables are not considered.
Ed. Passarelli
Ed. Brigadeiro Faria Lima
Ed. Top Center
Ed. Fujitsu
Ed. Parque Cultural Paulista
Ed. GPA
TEPP11’s portfolio is 100% located in São Paulo’s prime office submarkets
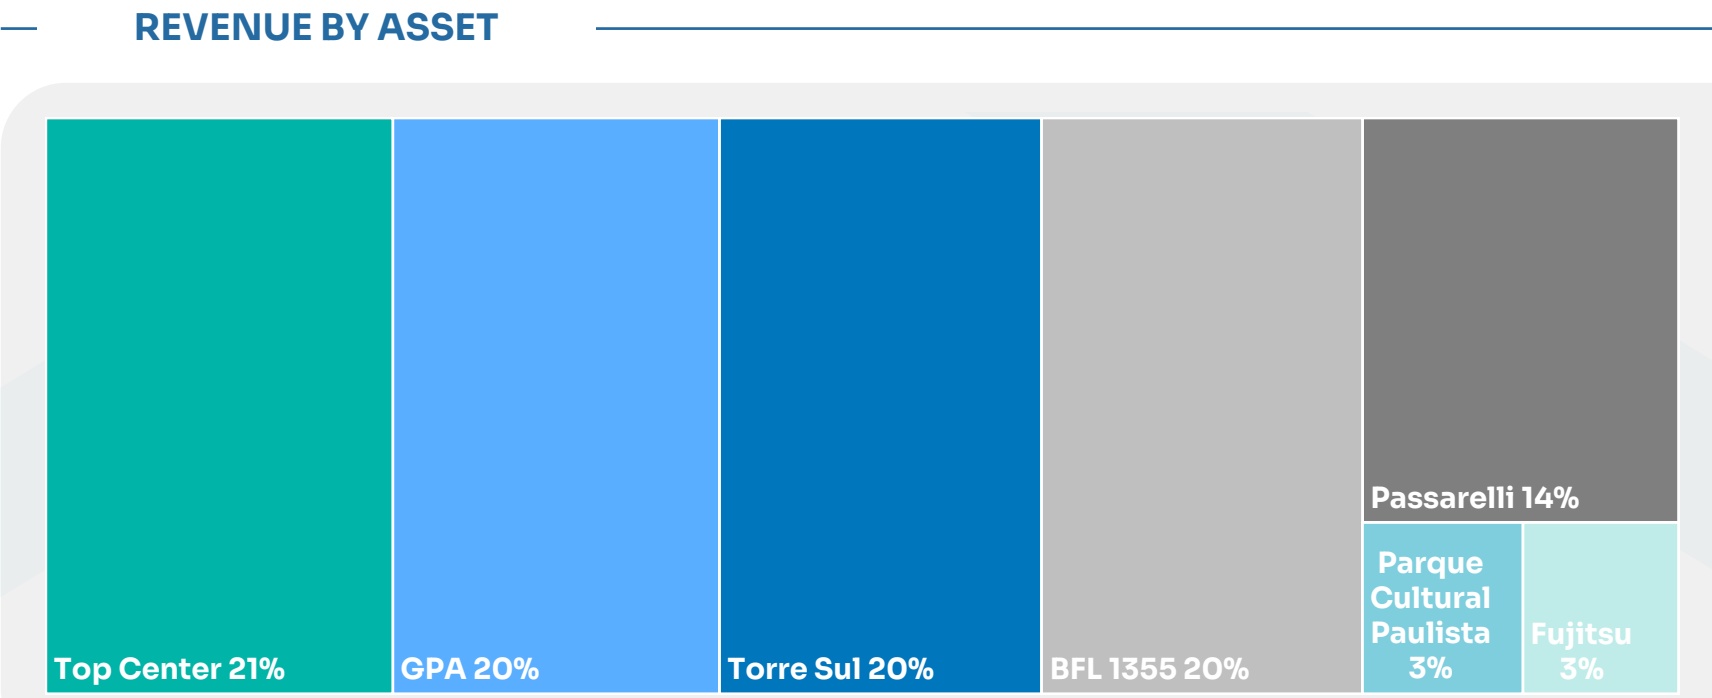
| ASSET | CLASSIFICATION | LEASEBLE AREA (sqm) | PHYSICAL VACANCY | FINANCIAL VACANCY | % ofASSET VALUE | NUMBER OF TENANTS |
|---|---|---|---|---|---|---|
| Torre Sul | A | 9,950 | 5.5% | 0.90% | 18.6% | 10 |
| Passarelli | B | 7,130 | 0.0% | 10.01% | 12.7% | 13 |
| Fujitsu | B | 4,985 | 0.0% | 0.00% | 8.3% | 3 |
| Brigadeiro Faria Lima | B | 5,761 | 0.0% | 0.00% | 16.4% | 2 |
| GPA | B | 11,224 | 0.0% | 0.00% | 17.6% | 1 |
| Top Center | B | 13,463 | 18.2% | 4.05% | 26.4% | 18 |
| Ed. Parque Cultural Paulista | B | 1,118 | 0.0% | 0.00% | 2.4% | 1 |
| Total | 57,845 | 10.91% | 4.07% | 100% | 48 |
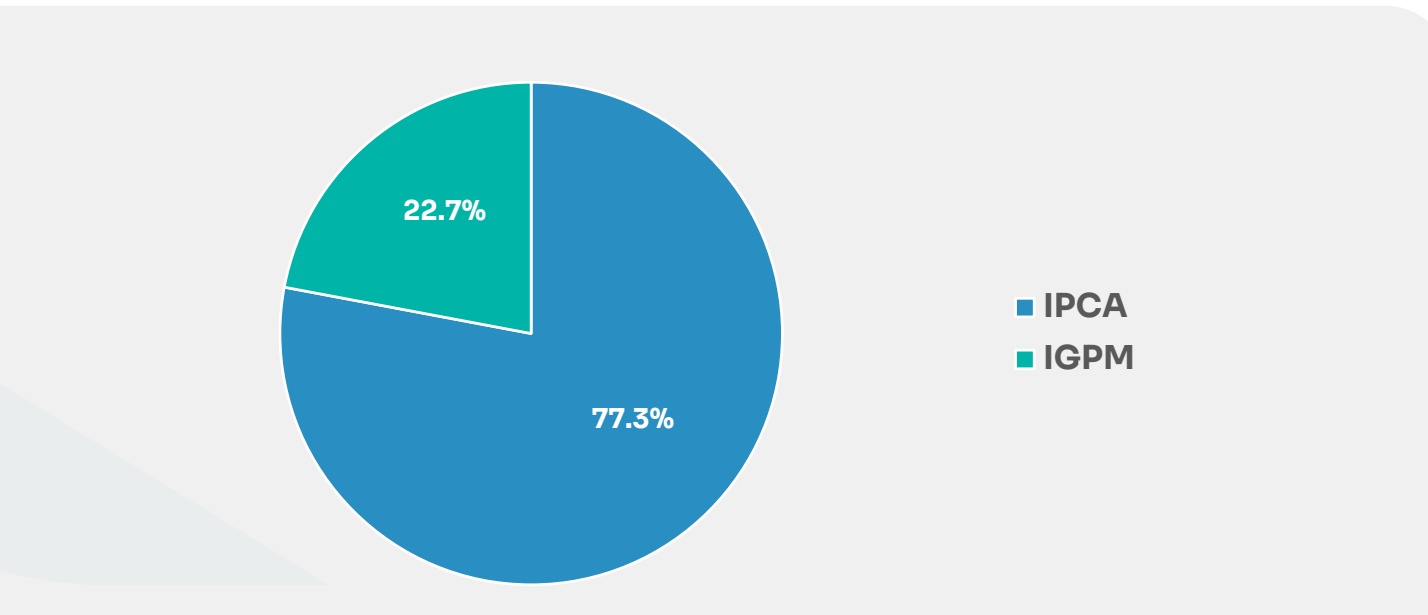
LEASE ADJUSTMENT INDEX
WAULT (YEARS)
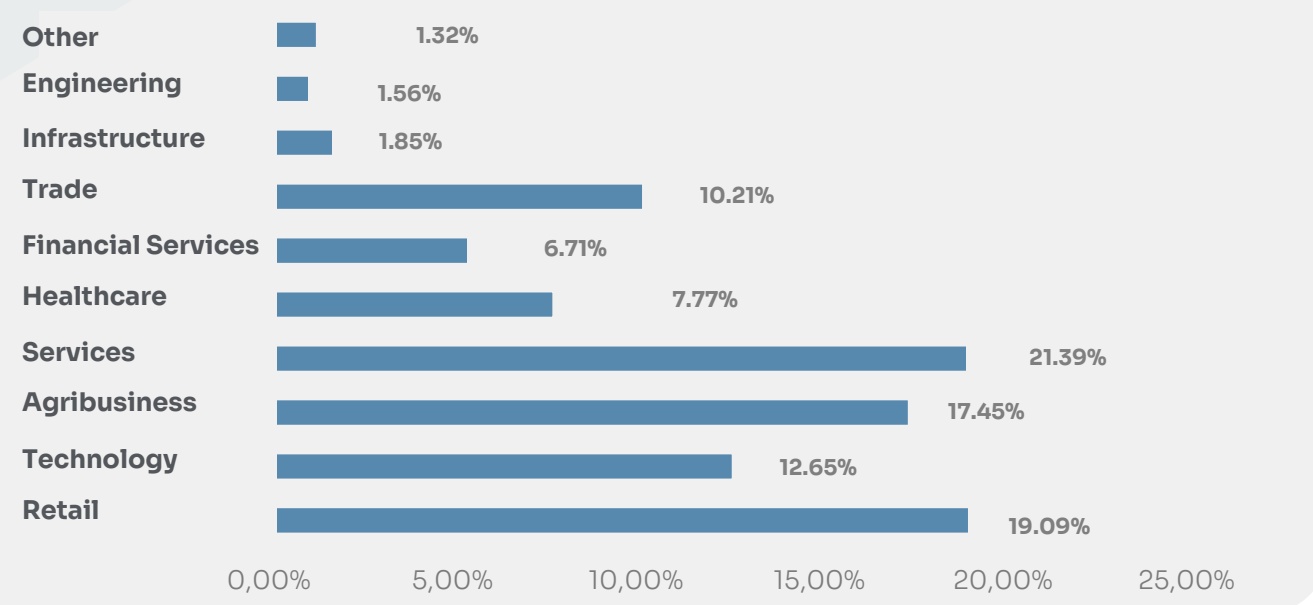
TENANT INDUSTRY SECTOR (AS % OF REVENUE)
_ LEASE READJUSTMENT (% OF RENTAL REVENUES)
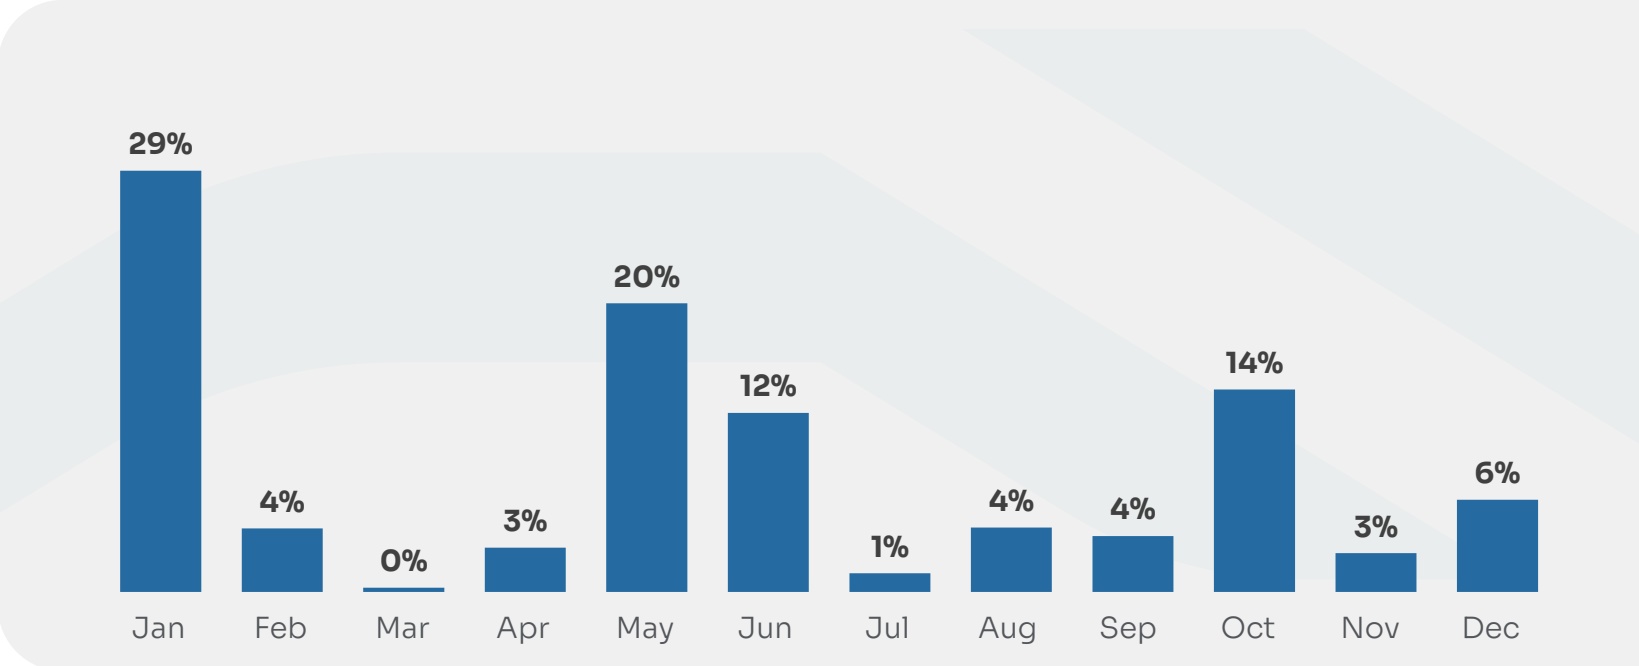
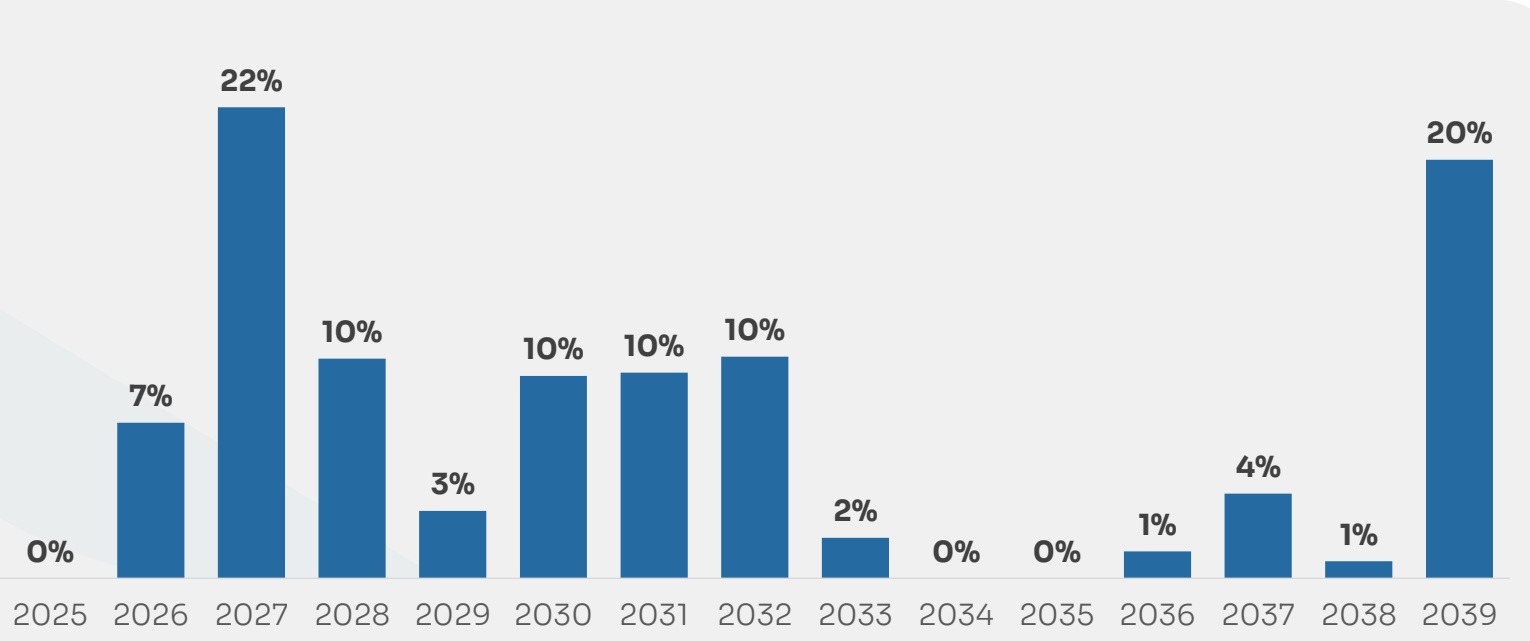
LEASE EXPIRATIONS (% OF RENTAL INCOME)
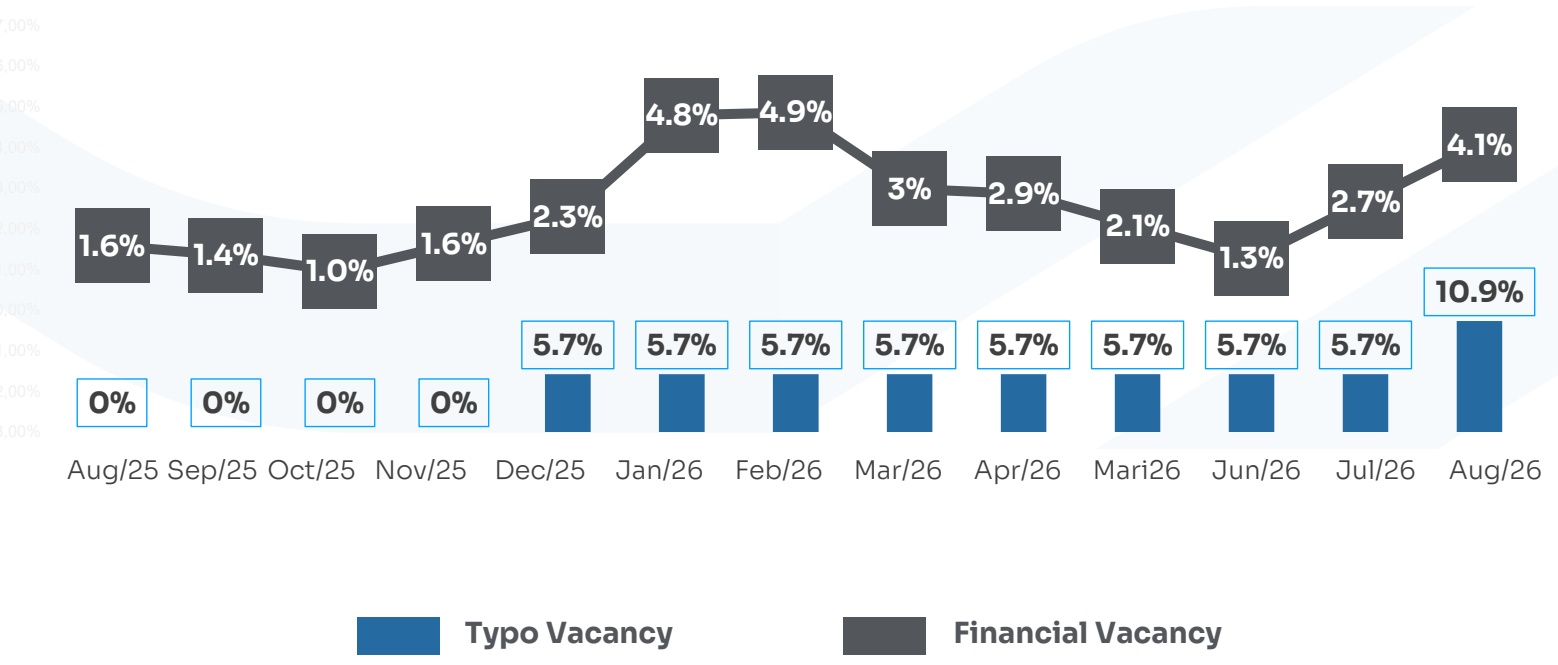
FINANCIAL & PHYSICAL VACANCY EVOLUTION
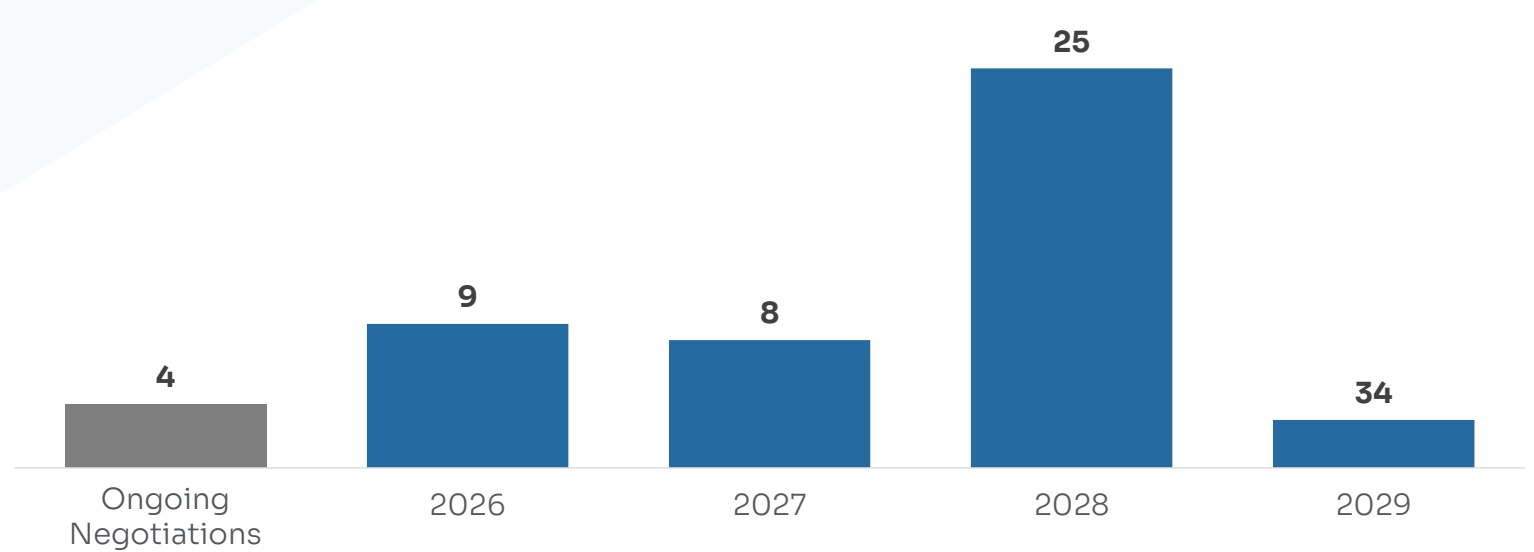
DISTRIBUTION OF RENT REVIEWS (NUMBER OF CONTRACTS)
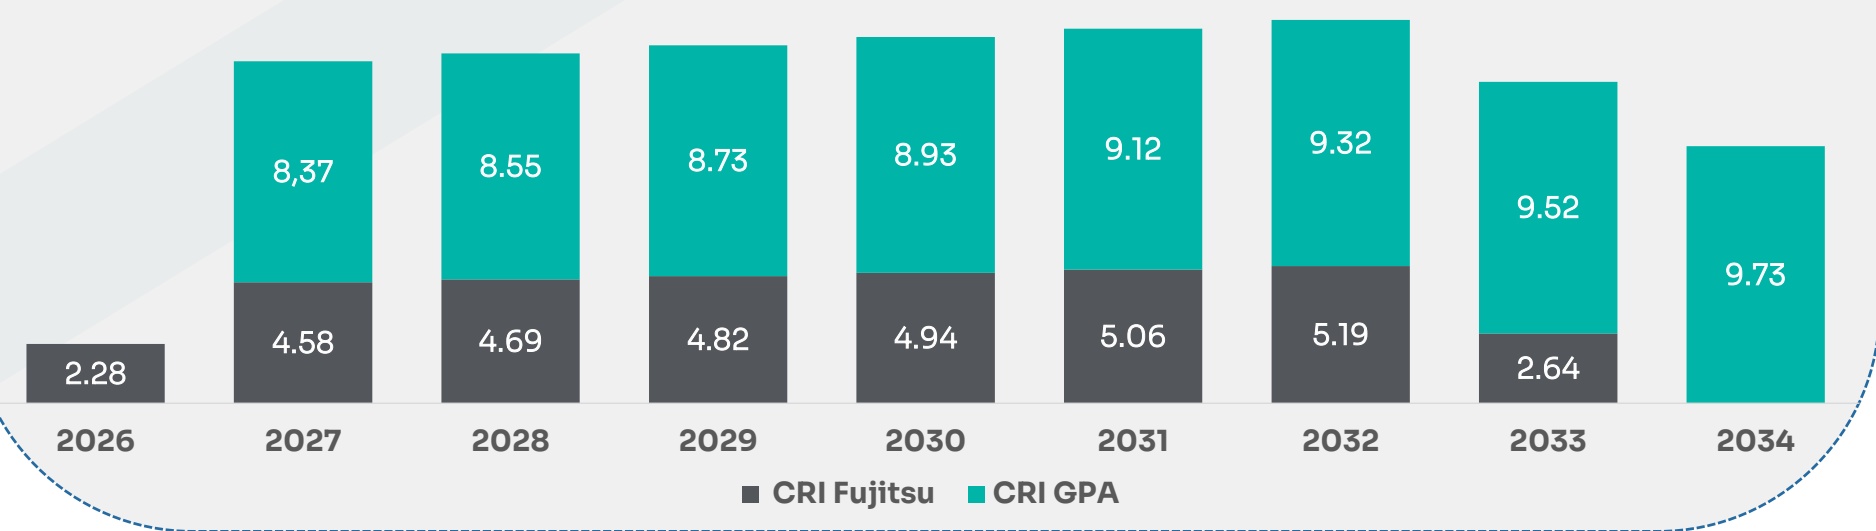
OUTSTANDING FINANCIAL DEBT
| CRI FUJITSU | CRI GPA | |
|---|---|---|
| IssueDate | Jun/21 | Dec/24 |
| Maturity | Jun/33 | Dec/34 |
| Index | IPCA | IPCA |
| InterestRate (p.y.) | 6.00% | 8.17% |
| PaymentFrequency | Monthly | Monthly |
| IssuedAmount(BRL) | 24,750,000 | 62,000,000 |
| UpdatedAmount(BRL) | 34,599,290 | 67,587,028 |
| AmortizationStart | Jul/26 | Jan/27 |
| NumberofAmortization Installments | 84 | 96 |
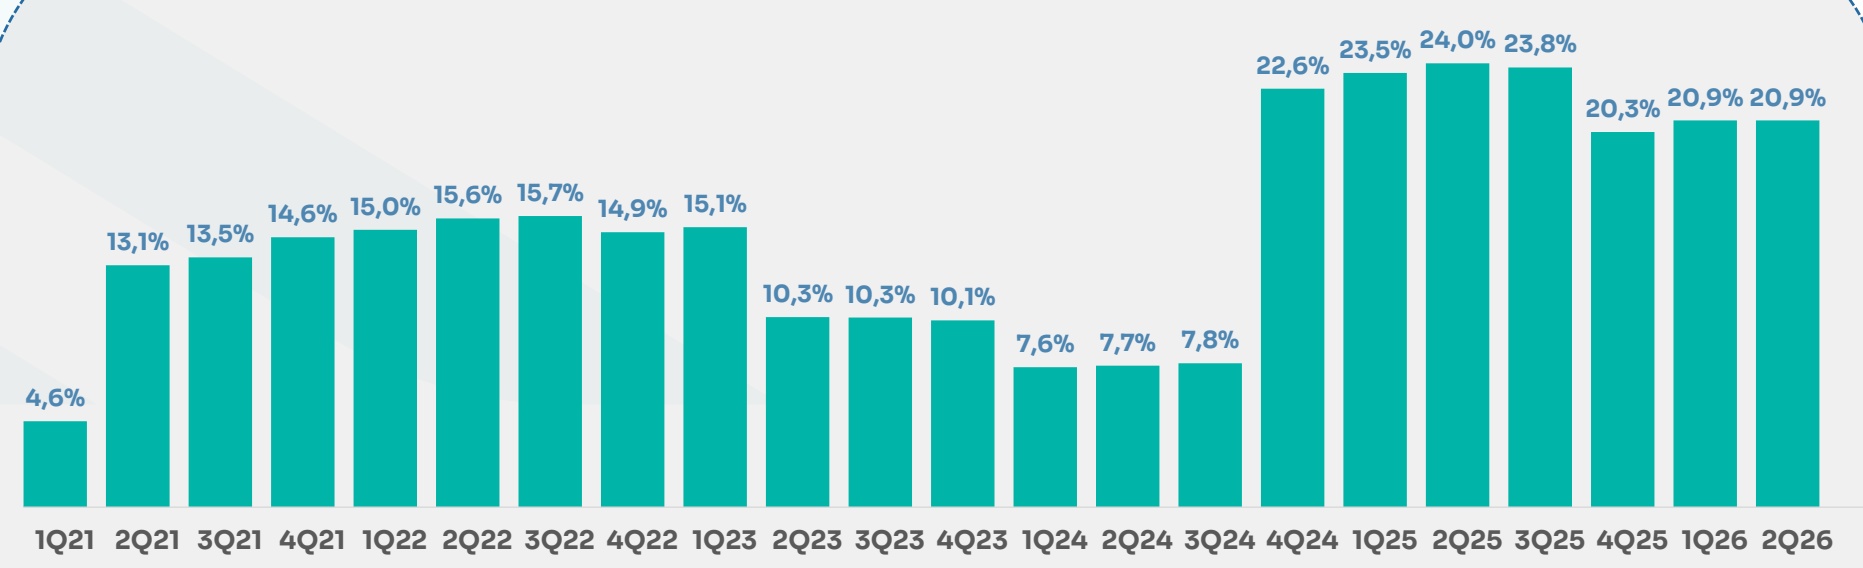
FUND LEVERAGE TREND (% OF NAV)
DEBT AMORTIZATION SCHEDULE (BRL MM)
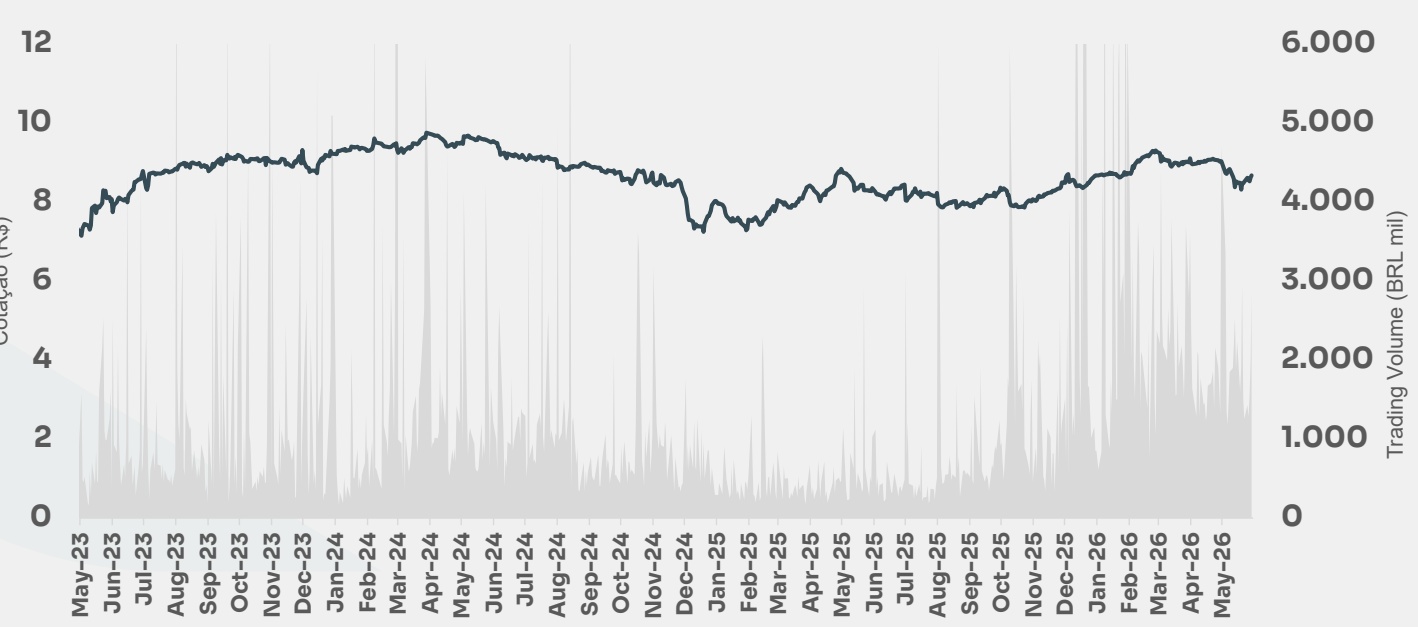
FUND UNITS TRADING ON B3
| B3 MARKET DATA | May/26 |
|---|---|
| Market Capitalization(BRL '000) | 413,980 |
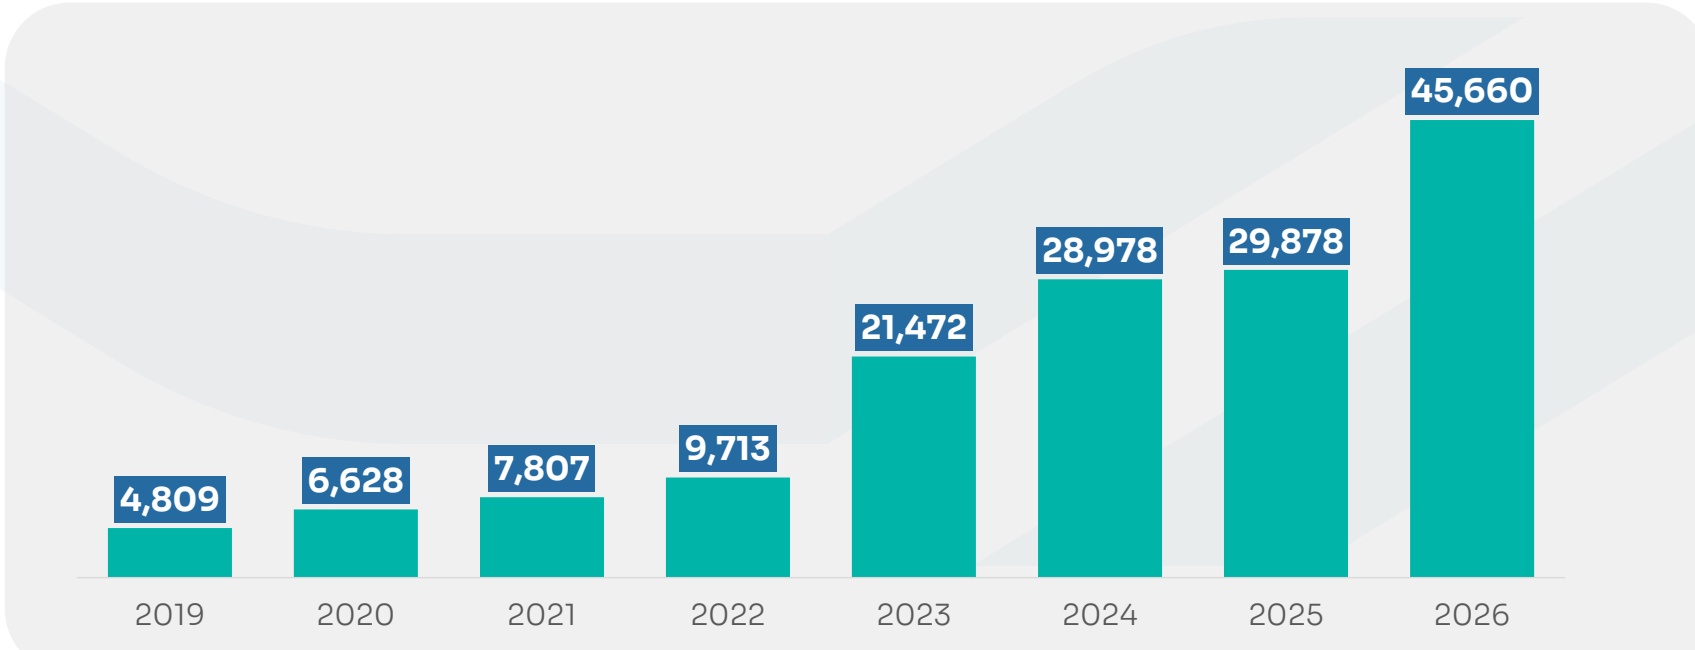
| NumberofShareholders | 45,660 |
| Daily Trading Presence | 100% |
| AverageDaily Trading Volume (BRL Thousand) | 1,177 |
| Turnover (% of Shares Traded in the month) | 6.6% |
HISTORICAL SHARE PRICE AND TRADING VOLUME
SHAREHOLDER BASE GROWTH
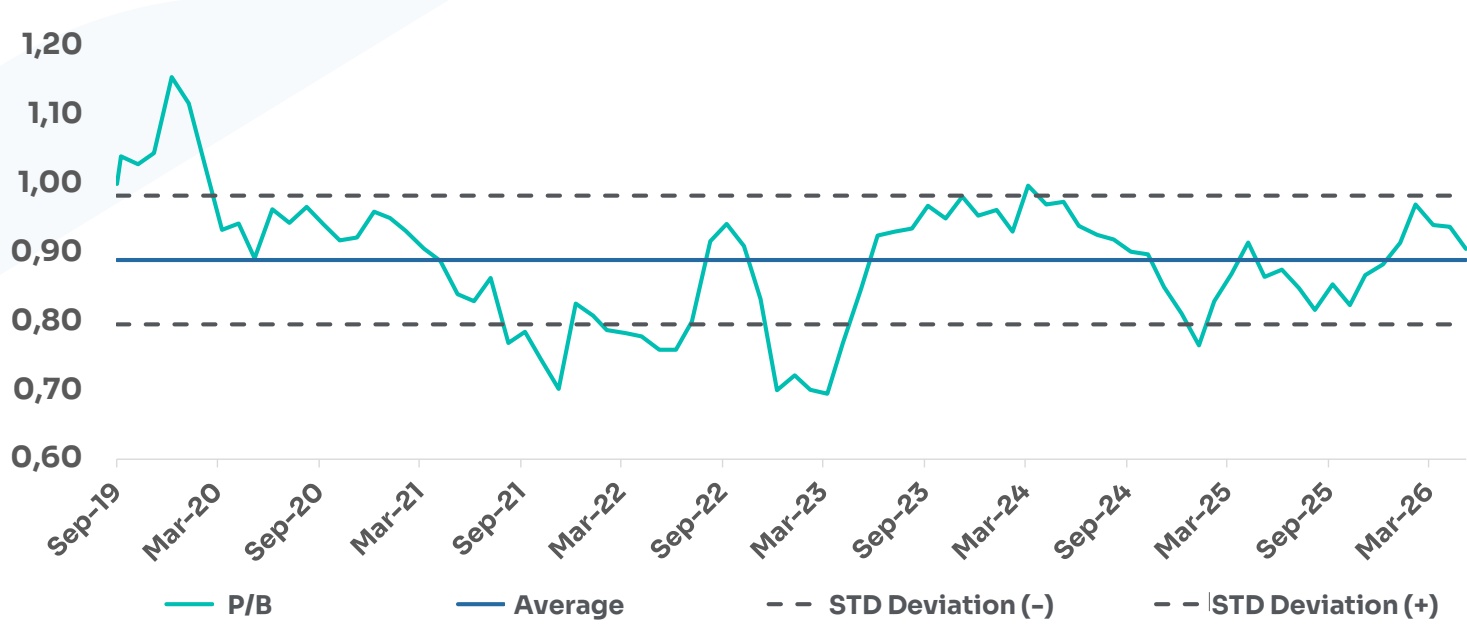
HISTORICAL P/B
DISTRIBUTION HISTORY
| 2019 | 2020 | 2021 | 2022 | 2023 | 2024 | 2025 | 2026 | |
|---|---|---|---|---|---|---|---|---|
| January | - | 0.055 | 0.050 | 0.047 | 0.049 | 0.064 | 0.080 | 0.075 |
| February | - | 0.056 | 0.045 | 0.047 | 0.050 | 0.064 | 0.095 | 0.075 |
| March | - | 0.049 | 0.045 | 0.049 | 0.051 | 0.100 | 0.095 | 0.080 |
| April | - | 0.049 | 0.045 | 0.049 | 0.052 | 0.105 | 0.095 | 0.131 |
| May | - | 0.050 | 0.045 | 0.050 | 0.055 | 0.118 | 0.095 | 0.131 |
| June | - | 0.050 | 0.042 | 0.050 | 0.081 | 0.118 | 0.110 | 0.131 |
| July | - | 0.052 | 0.038 | 0.049 | 0.058 | 0.078 | 0.091 | 0.131 |
| August | - | 0.050 | 0.045 | 0.049 | 0.058 | 0.078 | 0.074 | 0.125 |
| September | - | 0.050 | 0.048 | 0.049 | 0.058 | 0.078 | 0.074 | - |
| October | 0.027 | 0.047 | 0.048 | 0.050 | 0.064 | 0.078 | 0.074 | - |
| November | 0.034 | 0.050 | 0.048 | 0.050 | 0.064 | 0.078 | 0.074 | - |
| December | 0.055 | 0.052 | 0.051 | 0.051 | 0.090 | 0.078 | 0.075 | - |
| Total | 0.116 | 0.610 | 0.550 | 0.590 | 0.730 | 1.037 | 1.032 | 0.754 |
| Average | 0.290 | 0.051 | 0.046 | 0.049 | 0.061 | 0.086 | 0.086 | 0.108 |
¹ Source: Broadcast
| JAN | FEB | MAR | APR | MAY | JUN | JUL | AUG | SEP | OCT | NOV | DEC | Year | |
|---|---|---|---|---|---|---|---|---|---|---|---|---|---|
| TEPP11 | - | - | - | - | - | - | - | - | 0.0% | -0.6% | 2.2% | 11.1% | 12.8% |
| 2019 | |||||||||||||
| IFIX | - | - | - | - | - | - | - | - | 0.5% | 4.0% | 3.5% | 10.6% | 15.2% |
| TEPP11 | -2.7% | -7.3% | -9.2% | 1.7% | -4.8% | 8.5% | -1.6% | 3.0% | -2.2% | -2.1% | 1.2% | 3.8% | -12.3% |
| 2020 | |||||||||||||
| IFIX | -3.8% | -3.7% | -15.9% | 4.4% | 2.1% | 5.6% | -2.6% | 1.8% | 0.5% | -1.0% | 1.5% | 2.2% | -10.2% |
| TEPP11 | -1.0% | -1.7% | -2.4% | -1.6% | -5.1% | -0.7% | 4.5% | -10.5% | 2.7% | -4.6% | -5.3% | 14.8% | -12.1% |
| 2021 | |||||||||||||
| IFIX | 0.8% | -0.2% | -1.4% | 0.5% | -1.6% | -2.2% | 2.5% | -2.6% | -1.2% | -1.5% | -3.6% | 8.8% | -2.3% |
| TEPP11 | -1.7% | -2.1% | 0.0% | -0.1% | -2.0% | 0.6% | 6.0% | 15.3% | 3.3% | -2.6% | -8.0% | -10.1% | -3.1% |
| 2022 | |||||||||||||
| IFIX | -1.0% | -1.3% | 1.4% | 1.2% | 0.3% | -0.9% | 0.7% | 5.8% | 0.5% | 0.0% | -4.2% | 0.0% | 2.2% |
| TEPP11 | 3.7% | -2.2% | -0.1% | 11.3% | 10.8% | 9.8% | 1.3% | 1.1% | 4.2% | -1.2% | 4.1% | 0.0% | 48.6% |
| 2023 | |||||||||||||
| IFIX | -1.6% | -0.5% | -1.7% | 3.5% | 5.4% | 4.7% | 1.3% | 0.5% | 0.2% | -2.0% | 0.7% | 4.3% | 15.5% |
| TEPP11 | 1.5% | 1.0% | 5.7% | -1.5% | 1.6% | -2.4% | -0.6% | -0.4% | -1.3% | 0.7% | -4.5% | -2.1% | -1.8% |
| 2024 | |||||||||||||
| IFIX | 0.7% | 0.8% | 1.4% | -0.8% | 0.0% | -1.0% | 0.5% | 0.9% | -2.6% | -3.1% | -2.1% | -0.7% | -5.9% |
| TEPP11 | -4.9% | 7.8% | 5.8% | 6.1% | -4.4% | 2.3% | -1.4% | -2.3% | 5.8% | -2.6% | 6.2% | 2.1% | 18.2% |
| 2025 | |||||||||||||
| IFIX | -3.1% | 3.3% | 6.1% | 3.0% | 1.4% | 0.6% | -1.4% | 1.2% | 3.3% | 0.1% | 1.9% | 3.1% | 21.2% |
| TEPP11 | 1.6% | 7.0% | -1.0% | 0.7% | -2.5% | -5.4% | 0.2% | -1.8% | - | - | - | - | -1.2% |
| 2026 | |||||||||||||
| IFIX | 2.3% | 1.3% | -1.1% | 1.5% | -1.3% | -1.2% | -0.3% | -1.5% | - | - | - | - | -0.3% |
IPO Tellus Properties (TEPP11)
Aquisition - Ed. Cond. São Luiz BRL 145M (BRL 12.833/sqm)
Aquisition - Ed. Cond. São Luiz BRL 26,5M (BRL 14.100/sqm)
Aquisition - Ed. Passarelli BRL 63,42M (BRL 8.895/sqm)
Aquisition - Ed. Fujitsu BRL 50M (BRL 10.030/sqm)
Aquisition - Ed. Torre Sul BRL 115M (BRL 11.176/sqm)
Disposal - Ed. Cond. São Luiz BRL 215,0M (BRL 16.314/sqm) Capital Gain: BRL 39.4M
Aquisition - Ed. Brigadeiro Faria Lima BRL 95.0M (BRL 19.969/sqm)
Aquisition - Ed. GPA BRL 109,0M (BRL 9.710/sqm)
Aquisition - Ed. Passarelli BRL 13.4M (BRL13.211/m²)
Aquisition - Ed. Parque Cultural Paulista BRL 15.9M (BRL14.249/m²)
Aquisition - Ed. Torre Sul BRL 10,7M (BRL9.935/m²)
2019
2020
2021
2023
2024
2025
2026
Aquisition - Ed. Timbaúba BRL 26.5M (BRL 11.313/sqm)
Disposal - Ed. Timbaúba BRL 30.6M (BRL 13.072/sqm) Capital Gain: BRL 1.8M
Aquisition - Ed. Brigadeiro Faria Lima BRL 12.6M (BRL 12.562/sqm) Aquisition - Ed. Top Center BRL 167,4M (BRL 12.435/sqm)
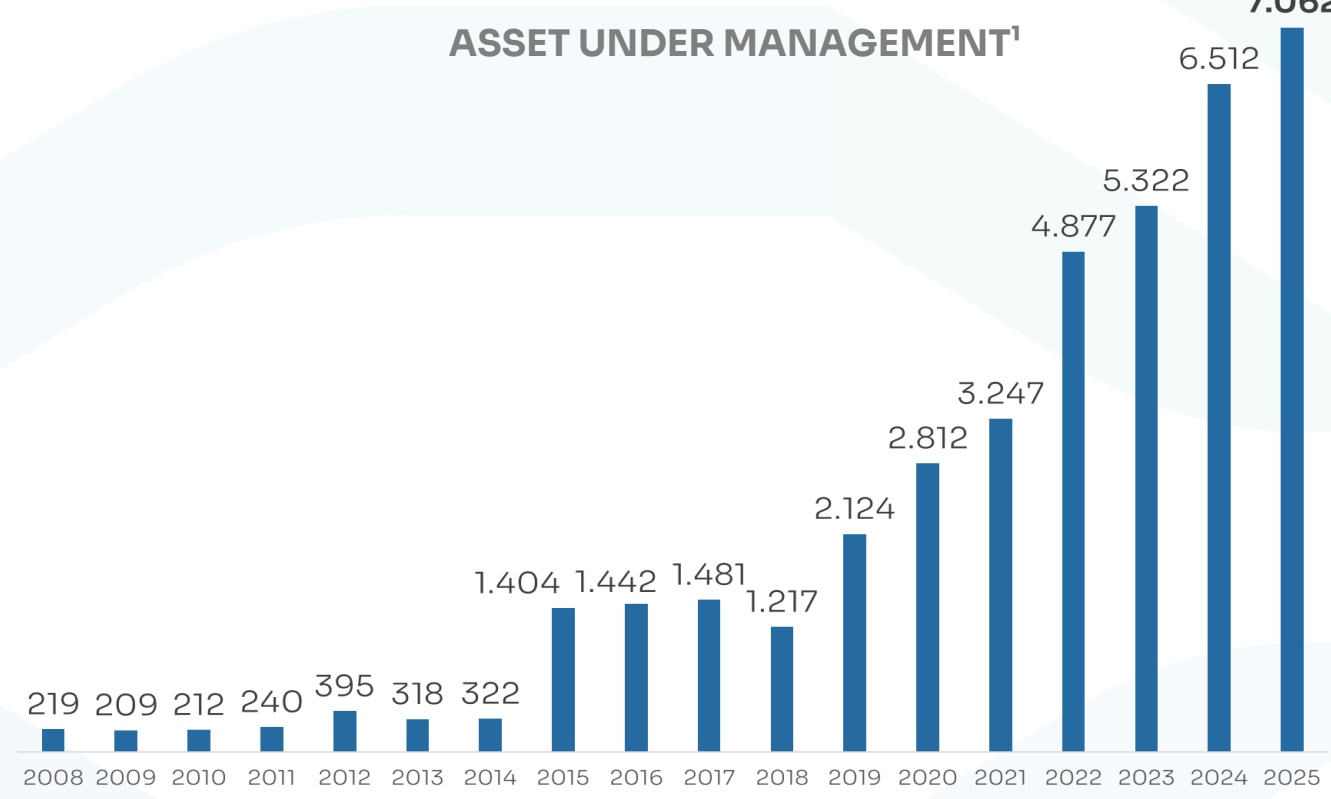
TELLUS is an independent asset management firm, with more than R$6.3* billion under management on real estate private equity. Since 2007, TELLUS has been active in all real estate sectors, with proven expertise in land entitlement, acquisition, development, redevelopment and value creation of office, industrial, mixed-use and for rent and for sale residential projects. We are committed with the transparency and fully integrated with our stakeholders. With an experienced and multidisciplinary team of professionals, TELLUS builds the capacity and agility to select assets to invest according to the different moments of the real estate market.
ASSET UNDER MANAGEMENT¹
AuM BY TYPE
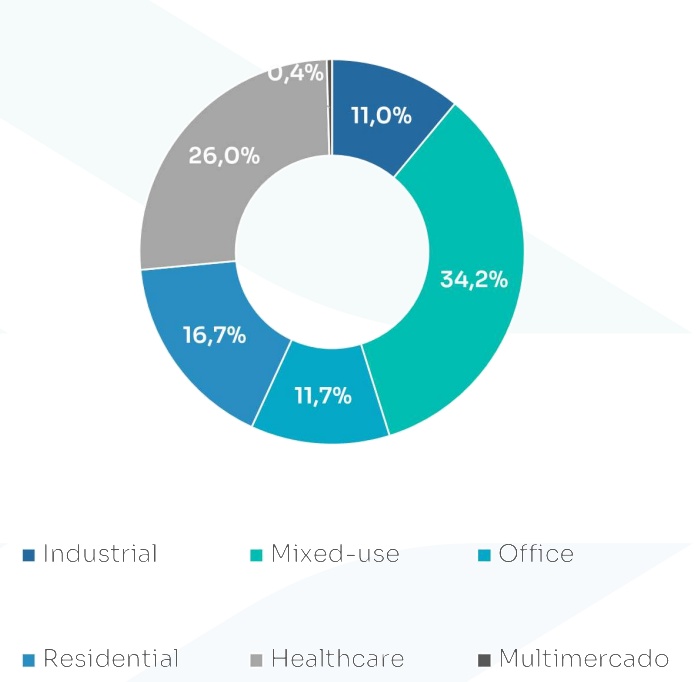
PRIVATE FUNDS
| BRL 6,076 | BRL 430,49 MM | TRBL11 | |
| BRL 474,01 MM | TEPP11 | ||
| BRL 31,52 MM | TELM11 |
FII/REIT
¹Source: TELLUS. Database: Dec./25
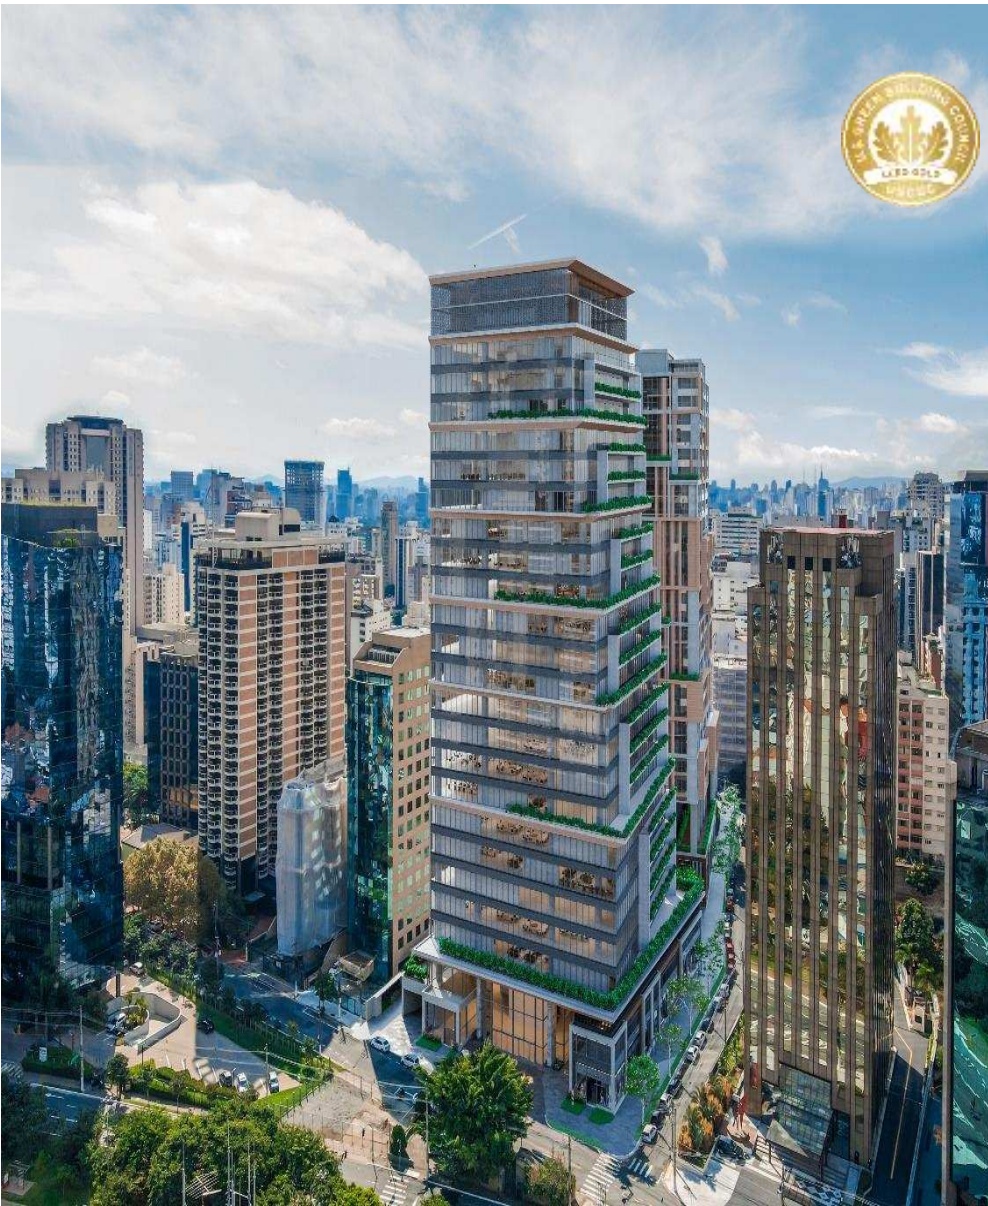
JK Square Itaim
Mixed-use project in a very well-located land plot at one of the best neighborhoods of São Paulo.
Sustainability Commitment

Tellus became a signatory to the PRI (Principles for Responsible Investment) in 2021, reflecting its commitment to understanding and addressing the environmental, social, and governance (ESG) implications of its investment activities. Tellus’ assets incorporate a set of principles, values, and guidelines that support the management of its investments.Tellus believes that, in the management of third-party capital, the consideration of ESG factors in investment decisions contributes to improved risk management and the creation of long-term value for clients and society as a whole. The PRI is an investor initiative in partnership with the United Nations Environment Programme Finance Initiative (UNEP FI) and the UN Global Compact. It works alongside its international network of signatories to implement the six Principles for Responsible Investment. These Principles aim to promote the integration of ESG considerations into investment and ownership decisions and to support signatories in this process. In addition, Tellus incorporates relevant responsible investment practices as part of its fiduciary duty.
Tellus conducts ESG assessments across its investment portfolio, enabling a broader view of associated risks and opportunities. The Tellus ESG assessment framework combines both an integration approach and a best-in-class methodology.
The integration approach consists of the systematic inclusion of ESG considerations in investment analyses and decision-making processes. Tellus performs this analysis through its due diligence procedures. If any environmental or other liabilities are identified, such as soil contamination, Tellus commits to implementing appropriate mitigation measures.
The best-in-class analysis is based on the Tellus ESG Score, which incorporates both ESG and financial criteria to evaluate each asset’s performance against environmental, social, and governance benchmarks. Tellus applies specific methodologies tailored to new developments, major refurbishments, and stabilized assets. After passing through these evaluation filters, each asset receives a final score with a corresponding adherence classification.
Additional Information
TEPP11
Tellus Investimentos
Contact and Social Media
Email: [email protected]
Click Here

▪ BOMA Area: Methodology adopted by the American association Building Owners and Managers Association. The BOMA area considers the sum of the private area and the prorata allocation of common areas, excluding staircases, elevator shafts, and technical areas.
▪ Financial Vacancy: accounts only for rent-free periods and discounts on existing leases relative to potential gross revenue.
▪ WAULT (Weighted Average Unexpired Lease Term): Weighted average remaining lease term of existing lease agreements, weighted by contracted rent.
▪ Cap Rate: Property capitalization rate.
Thank You!
+55 11 4280-4314 | [email protected]
Av. Brigadeiro de Faria Lima, 2179 10º floor I São Paulo – SP 01452-001
TELLUS.COM.BR