
Outros Relatórios TEPP11 de 30/01/2026
Outros Relatórios do Tellus Properties (TEPP11), fundo imobiliário de tijolo, com data de referência em 30/01/2026, com entrega no FundosNet (B3) em 15/04/2026. No pregão de 04/11/2026, a cota do TEPP11 fechou a R$ 6,69, com P/VP de 0,70 (valor patrimonial de R$ 9,53 por cota no informe mensal de setembro de 2026). O último rendimento foi de R$ 0,068 por cota, com pagamento em nov/2026, e o dividend yield dos últimos 12 meses é de 17,29% sobre a cotação de 04/11/2026. O patrimônio líquido era de R$ 512,3 milhões no informe mensal de setembro de 2026. Os indicadores são os mais recentes da base do Kartac, não os do período do documento.
Informações
- Fundo
- TELLUS PROPERTIES RESPONSABILIDADE LIMITADA-11,16%
- CNPJ
- 26.681.370/0001-25
- Tipo
- Relatórios
- Assunto
- Outros Relatórios
- Data de referência
- 30/01/2026
- Data de entrega
- 15/04/2026 18:55
- Versão
- 1
- Situação
- (Ativo)
Conteúdo

TELLUS PROPERTIES FII TEPP11
MONTHLY MANAGEMENT REPORT January | 2026
| 1 A TELLUS TABLE OF CONTENTS À / / |
|---|
| . FUND PERFORMANCE 3 |
| MANAGER’S LETTER 4 |
| DISTRIBUTION PROJECTIONS 5 |
| PORTFOLIO 6 |
| FINANCIAL STATEMENTS 9 |
| PROJECTED CASH FLOW 10 |
| PORTFOLIO – CONSOLIDATED OVERVIEW 11 |
| PORTFOLIO – OPERATIONAL INDICATORS 12 |
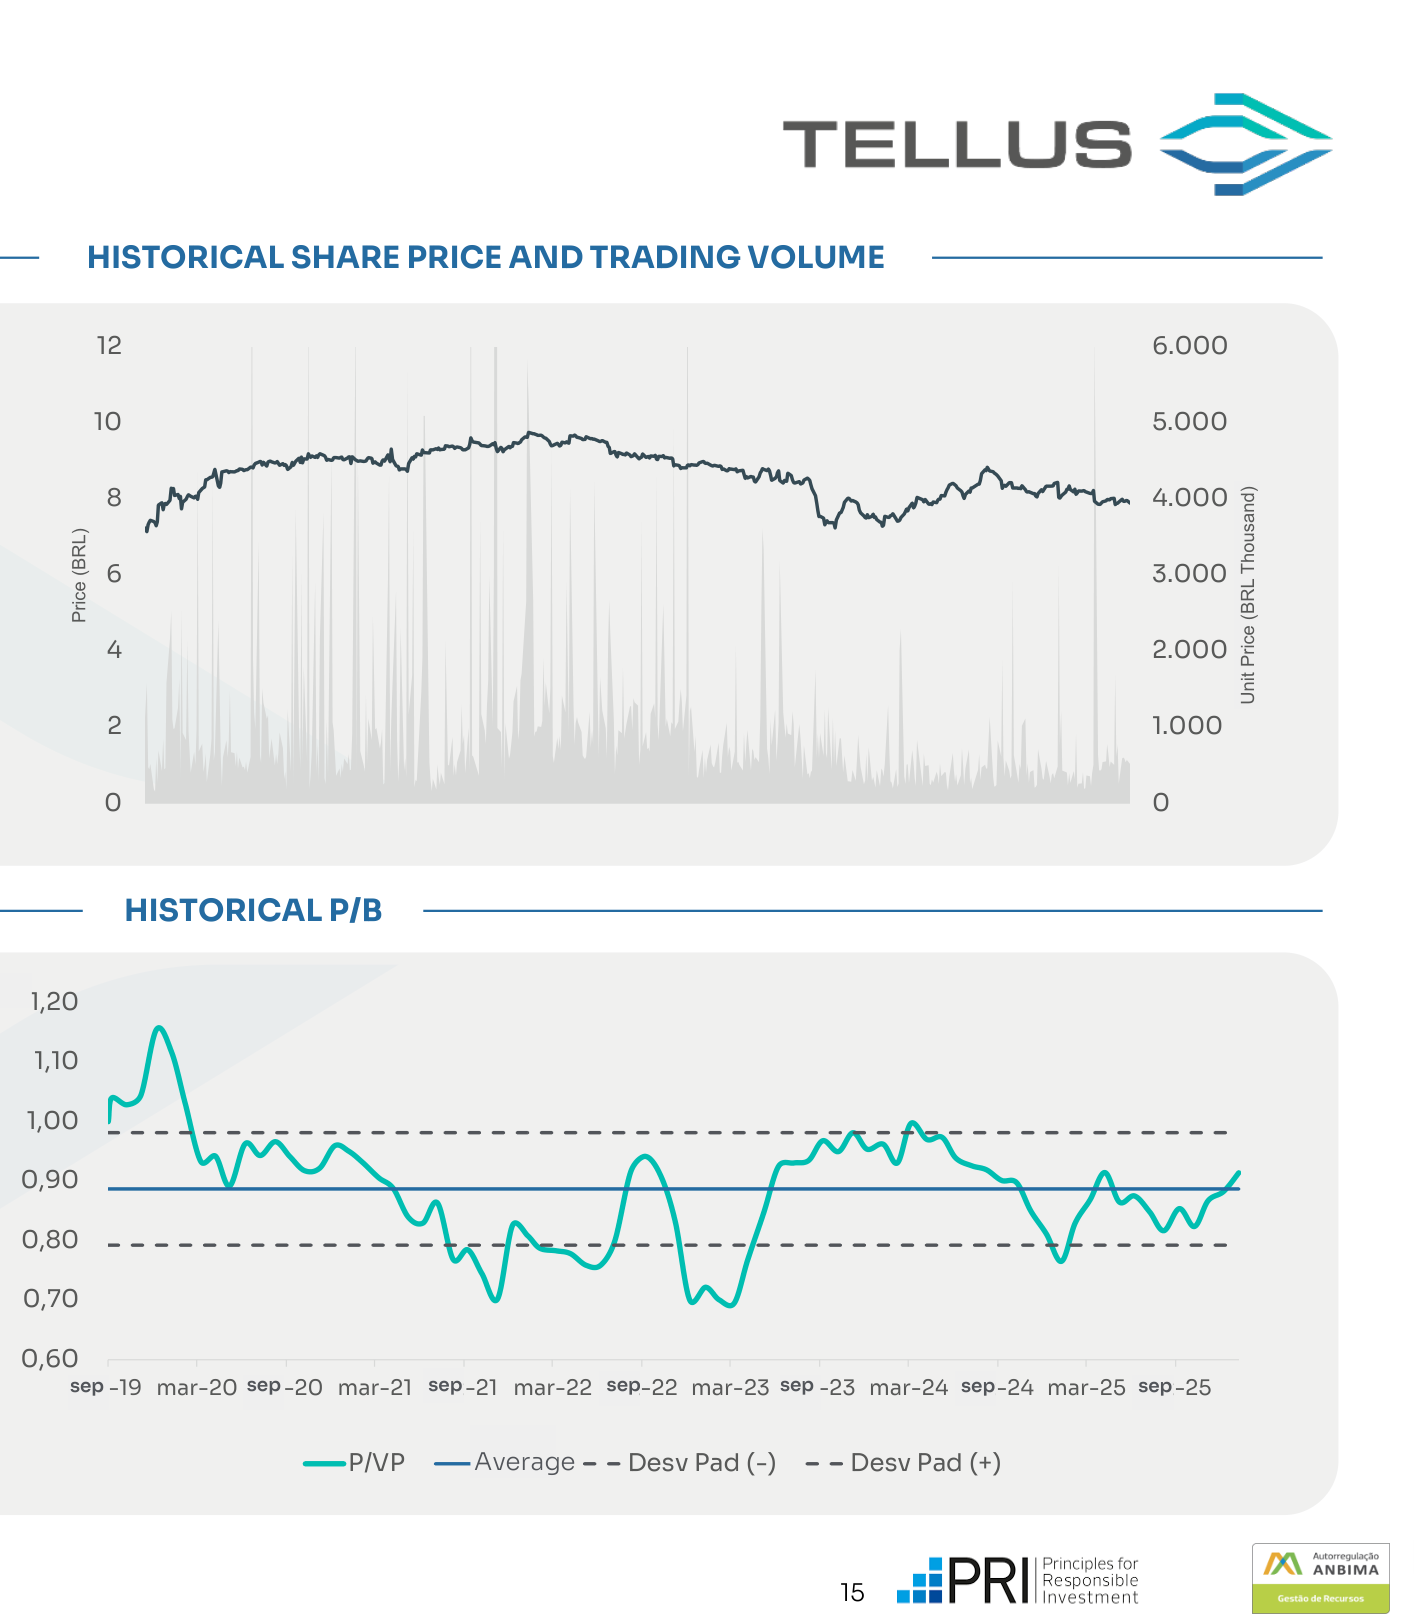
| SECUNDARY MARKET 15 |
| PERFORMANCE 16 |
| TIMELINE – ACQUISITIONS AND DISPOSALS 17 |
| THE MANAGER 18 |
~~ABOUT THE FUND~~
TELLUS PROPERTIES FII
TEPP11 is an office-focused real estate fund dedicated to acquiring well-located properties with transformation and valueadd potential. The transformation process involves assessing each building’s potential, taking into account factors such as average rental levels, services offered to tenants, accessibility, and improvements that may enhance the asset’s value, ultimately driving revenue growth for the Fund. This process is led by Management, which carefully evaluates costs, timelines, and implementation stages of the proposed improvements, often involving refurbishment works. Management is committed to providing transparency throughout the process, regularly reporting on the progress of each initiative.
FUND CHARACTERISTICS
TICKER
TEPP11
MANAGEMENT
Tellus Investimentos e Consultoria Ltda.
ADMINISTRATOR
BTG Pactual Serviços Financeiros S.A. Distribuidora de Títulos e Valores Mobiliários.
~~GENERAL INDICATORS~~

| Net Asset Value | Fund Market Capitalization | Dividend Yield (monthly) | P/B |
|---|---|---|---|
| BRL 474,282,194.02 | BRL 433,651,907 | 0.86% | 0.91 |
| Net Asset Value per Share | Market Share Price | Dividend Yield (annualized) | ADTV |
| BRL 9.56 | BRL 8.74 | 10.80% | BRL 3,374,886 |
CNPJ
26.681.370/0001-25
AUDITOR
~~OPERATING INDICATORS~~
Ernest & Young Auditores Independentes
TRADING START DATE ON B4
26/09/2019
MANAGEMENT FEE
0,90% a 1% a.a.
ADMINISTRATION FEE
0,13% a.a.
TAX
In accordance with the Fund’s by laws, offering memorandum, and laws nº. 8,668/93 and nº. 9,779/1999.
| Number of Assets | Leasable Area ( per sqm) Typo Vacancy | Number of Shareholders |
|---|---|---|
| 6 | 39,391 5.69% | 33,979 |
| Number of Tenants | WAULT (Years) Financial Vacancy | Asset Value ( per sqm) |
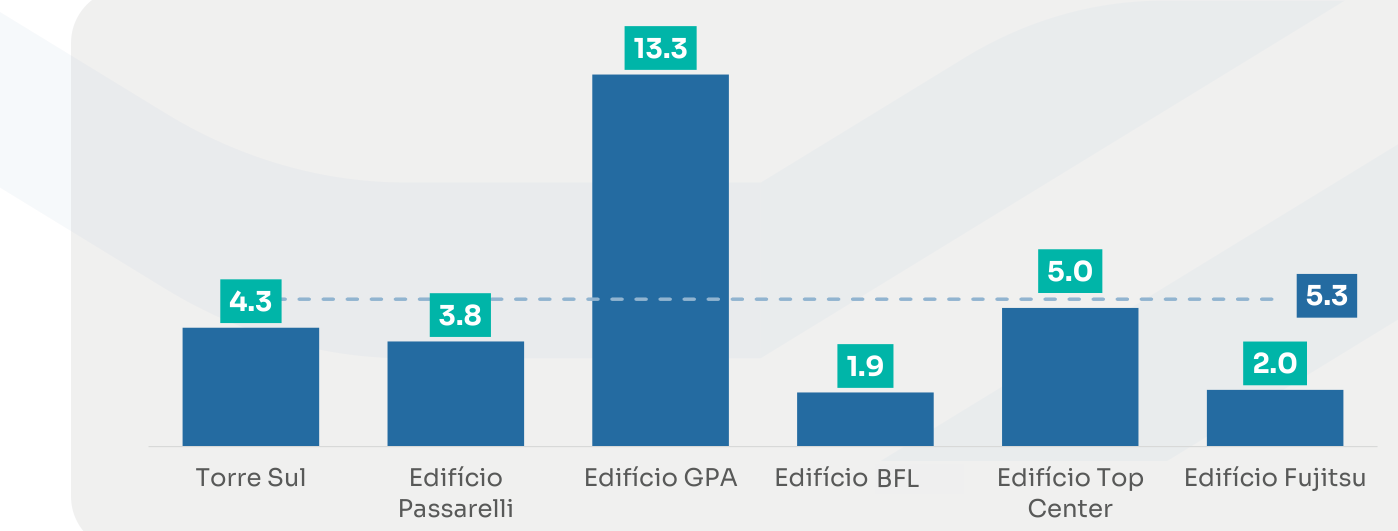
| 47 | 5.3 2.30% | BRL 10,872 |
| Watch Management’s report p | resentation onYouTube channel , YouTube channel or listen onSpotify . | |
| TEPP11's new website |

/>
At its
to
the
already
periods,
market
asa
Manager’s Letter
~~MARKET OVERVIEW~~
Global markets started 2026 on a positive note in January, with attention focused on the U.S. interest rate trajectory following the cuts implemented at the end of 2025. At its January 28 meeting, the Federal Reserve decided to keep the policy rate unchanged at 3.50%–3.75%, reinforcing its “data-dependent” approach in an environment where inflation remains above target but shows signs of stabilization in the labor market.
In Brazil, the IPCA rose 0.33% in January, bringing 12-month inflation to 4.44%. Although still above the midpoint of the target range, inflation is now below the upper bound. At its first meeting of the year, also on January 28, the Monetary Policy Committee (Copom) maintained the Selic rate at 15.00% per annum and signaled caution in calibrating its next steps. The market has begun discussing the potential start of a rate-cutting cycle in upcoming meetings, should disinflation trends and inflation expectations continue to converge.
In terms of domestic asset performance, the Ibovespa posted a strong gain of 12.56% in January, closing the month at 181,363 points, supported by foreign inflows and the repricing of cyclical assets. The IFIX advanced 2.27%, ending the month at 3,860.99 points, reflecting a more gradual yet still consistent improvement in investor sentiment toward the sector. In the foreign exchange market, the Brazilian real appreciated against the U.S. dollar, with the commercial rate closing January at BRL 5.248, representing a 4.4% decline in the dollar over the month, despite a brief uptick on the final trading day.
~~FUND HIGHLIGHTS~~
TEPP11 closed January with its units trading at BRL 8.74 and distributed BRL 0.075 per unit, representing an annualized dividend yield of 10.80%. Following the integration of Top Center into the Fund’s portfolio, and after 28 consecutive months with 100% physical occupancy, the Fund returned to a vacancy position, which now represents 5.7% of total GLA. Additionally, one of the tenants at Ed. Torre Sul, AT&T, renewed its lease agreement with a reduction in occupied area to half a floor (542 sqm), resulting in a temporary vacancy at the property.
Management has initiated discussions with market participants and brokerage firms with the objective of accelerating the absorption of vacant areas in both assets. In January, a lease proposal was received for the first floor of Top Center, considered the most challenging area of the building due to the scope of interventions required to accommodate the new tenant. The proposal is currently under negotiation between Management and the prospective tenant. It is worth noting that, in the feasibility study conducted at the time of the Top Center acquisition, the absorption of one floor (out of the three currently available) every eight months was projected, starting in April. Accordingly, performance to date remains consistent with the original assumptions of the investment thesis.
At Ed. Fujitsu, an additional full floor (691 sqm) was leased to a new tenant, concurrently with a partial termination executed by Fujitsu itself, in line with the movement already observed in the previous month.
In the secondary market, the Fund maintained a trend of strong average daily liquidity, reaching BRL 3.38 million and BRL 3.16 million over the 30-day and 60-day periods, respectively. The number of unitholders also increased, with a net addition of 4,101 investors during the month. Lastly, the Fund was included in the recommended portfolios of Banco Santander and BTG, while maintaining its presence in XP’s recommended portfolio, reinforcing market recognition of the Fund’s strategy and the returns delivered to investors.
Distribution Projections

TELLUS <>
=
~~DIVIDEND YIELD AND DISTRIBUTION PER SHARE~~
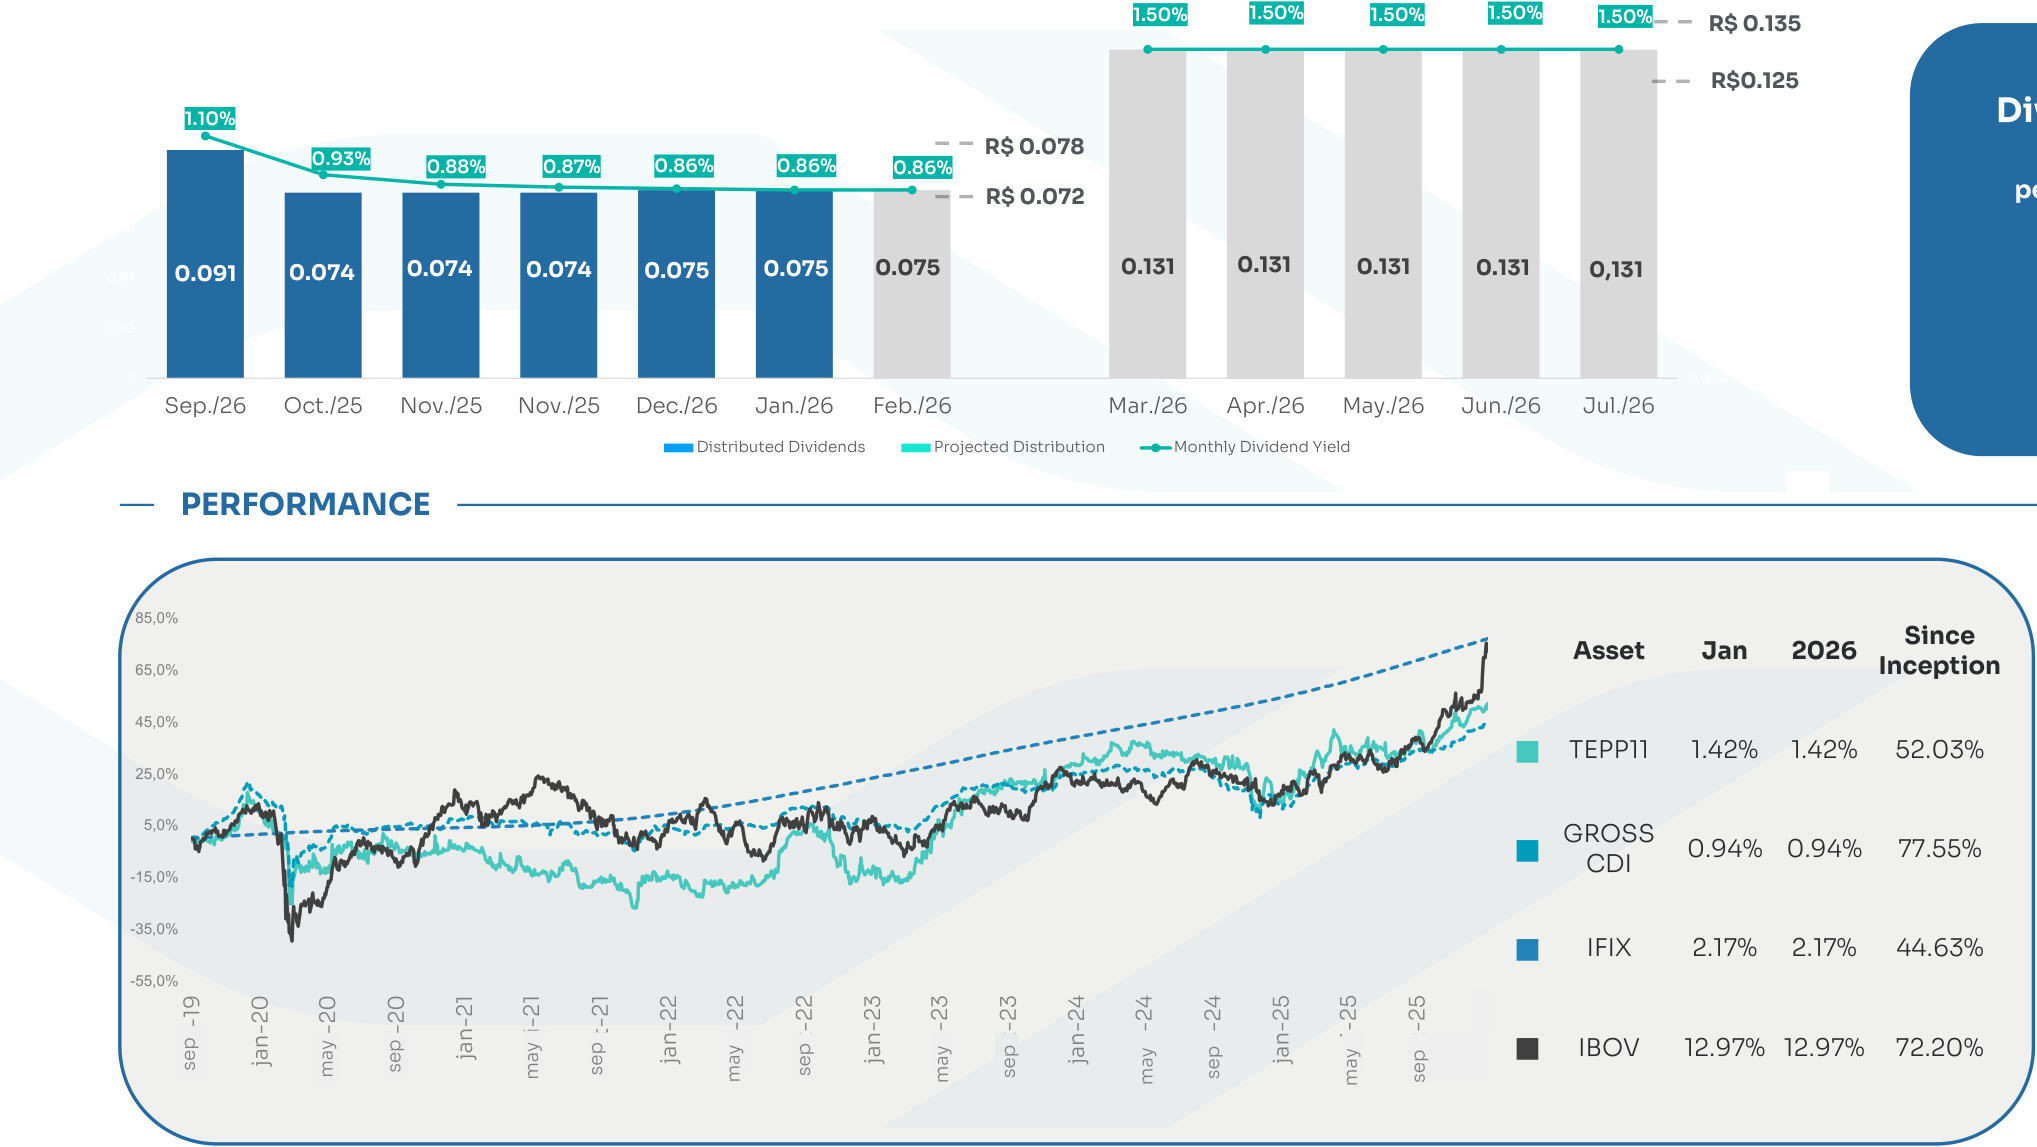

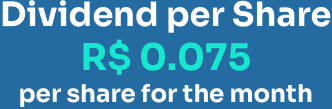
Dividend Yield

| ASSET | % IFIX | P/B | ANNUALIZED DIVIDEND YIELD ² |
|---|---|---|---|
| FII 1 | 0.20% | 1.01 | 10.4% |
| TEPP11 | 0.24% | 0.91 | 11.2% |
| FII 2 | 0.30% | 0.91 | 13.2% |
| FII3 | 0.96% | 0.84 | 14.6% |
| FII 4 | 0.66% | 0.82 | 17.9% |
| FII5 | 1.50% | 0.78 | 6.7% |
| FII6 | 0.22% | 0.71 | 13.5% |
| FII 7 | 0.34% | 0.70 | 8.2% |
| FII8 | 0.46% | 0.68 | 20.9% |
| FII 9 | 0.94% | 0.65 | 8.7% |
| FII 10 | 0.89% | 0.59 | 10.6% |
| FII 11 | 0.30% | 0.55 | 11.3% |
| FII 12 | 0.46% | 0.54 | 11.7% |
| FII 13 | 0.23% | 0.45 | 14.1% |
| AVERAGE³ | 7.69% | 0.70 | 11.6% |
The distribution projection disclosed does not constitute a promise or guarantee of returns. It is an estimate based on Management’s current assumptions and may be revised at any time in light of new facts, events, or changes in market conditions. ¹ Assumed tax rate of 15%
² Dividends based on December 2025
³ Value weighted by Net Asset Value
Portfolio
~~ED. TORRE SUL~~
Location: R. James Joule, 65 | Berrini % Ownership: 49.5%
- Leasable Area (sqm): 9,950 LEED Certification: Platinum
Classification: A
Torre Sul is a Class A office building located in the Berrini submarket of São Paulo, integrated into the Centro Empresarial Nações Unidas (CENU) complex. Delivered in 2004, the property comprises 16 typical office floors, with floor plates ranging from approximately 865 sqm to 1,081 sqm of Gross Leasable Area (GLA).The building features five underground parking levels, central air conditioning, raised flooring, modular suspended ceilings, building automation systems, and a full-capacity backup generator serving 100% of the property. It offers a clear ceiling height of 2.80 meters and complementary infrastructure including an auditorium, a fully operational helipad, and 24-hour security systems.Additionally, the property is located approximately 800 meters from Berrini Station
PORTFOLIO UPDATE
During the month, Management, in coordination with the property manager and the Advisory Board, defined the main priorities for the year.
For 2026, the focus will be concentrated on the modernization and value enhancement of the asset’s common areas, with emphasis on: • Refurbishment of the basement levels, including the application of epoxy coating across all floors; • Replacement of the elevator control panels; • Development of the design project for the new helipad waiting lounge;
- Definition of a new usage concept for the building’s rooftop;
~~ED. PASSARELLI~~
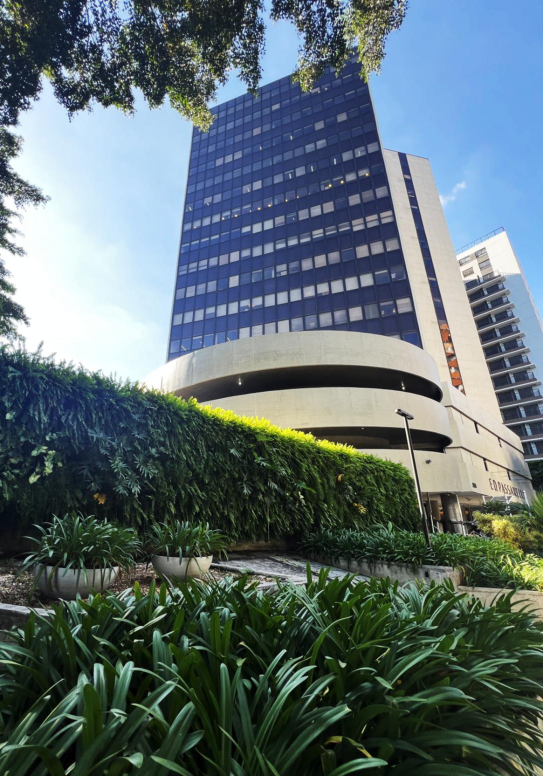
Location: R. Paes Leme, 524 | Pinheiros % Ownership: 52.8% Leasable Area (sqm): 7,130 LEED Certification: Platinum Classification: B

Delivered in 1980, Edifício Passarelli is a Class B office building located in the Pinheiros submarket of São Paulo. The property comprises 17 floors, with typical floor plates of approximately 1,019 sqm of Gross Leasable Area (GLA) per floor, subdivided into six office suites.The building features central air conditioning, building automation systems, a backup generator serving the common areas, and LEED Platinum certification. It also includes one underground parking level, ground-level parking, and three upper parking levels.The asset is situated in a well-established office district, with direct access to Pinheiros Station (CPTM/Metro) and close proximity to the Faria Lima and Marginal Pinheiros corridors.
PORTFOLIO UPDATE
In line with the other assets in the portfolio, investment priorities for the year were defined in January, with a focus on modernizing and upgrading the building’s common areas. The main initiatives include:
Construction of a new waste storage area; Full replacement of the gypsum ceilings in the floor lobbies; Completion of the glass wall along the Marginal Pinheiros and Rua Paes Leme frontage; Installation of a new access turnstile in the first basement level, equipped with facial recognition technology; Renovation of the audiovisual room located on the top floor of the building;
Portfolio
~~ED. FUJITSU~~
Location: R. Treze de Maio, 1633 | Paulista % Ownership: 52%
- Leasable Area (sqm): 4,985
LEED Certification: Gold
Classification: B
Developed in 1994, Edifício Fujitsu is a Class B office building located in the Paulista submarket of São Paulo. The property comprises 14 floors, with typical floor plates of approximately 681 sqm of Gross Leasable Area (GLA).
The building features central air conditioning, raised flooring, a clear ceiling height of 2.60 meters, a backup generator serving the common areas, and LEED Gold certification.
The asset is located near Brigadeiro and Vergueiro metro stations, close to Shopping Pátio Paulista, and offers convenient access to Paulista, 23 de Maio, Bernardino de Campos, and 9 de Julho avenues.
PORTFOLIO UPDATE
At Edifício Fujitsu, Management is planning a new phase of interventions and investments focused on the modernization and value enhancement of the asset. Among the initiatives under evaluation, the following stand out:
• Replacement of the entrance gate, with alternative options under consideration including the installation of a glass wall or the full opening of the property’s frontage;
Painting and refurbishment of the parking garage;
• Requalification of the outdoor amenity area;
• Modernization of the elevators;
• Development of a lighting design project for the garden and building perimeter;
Implementation of a water reuse system;
Preparation of a redevelopment project for the top floor, with potential use as an event space;
~~ED. BRIGADEIRO FARIA LIMA (BFL)~~
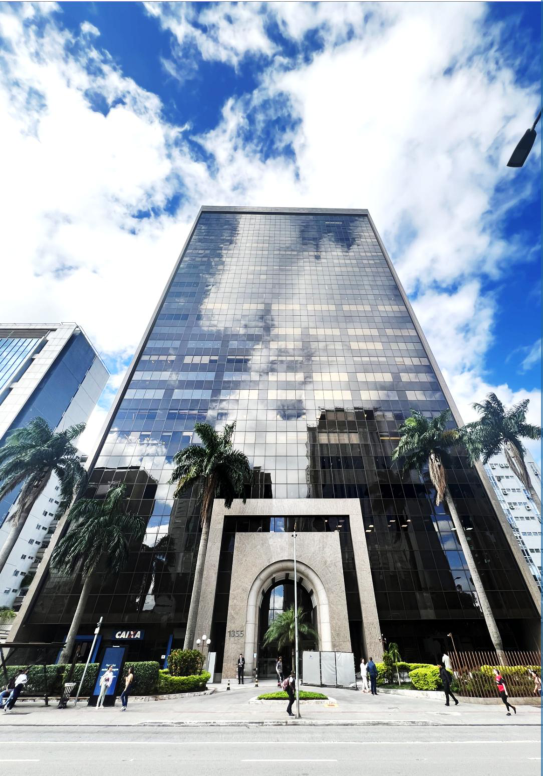
Location: Av. Brigadeiro Faria Lima, 1355 | Faria Lima % Ownership: 25.7%
Leasable Area (sqm): 5,761 LEED Certification: In process Classification: B

Edifício Brigadeiro Faria Lima is a Class B office building located in the Faria Lima submarket of São Paulo. Developed in 1986, the property comprises 23 floors, with typical floor plates of approximately 951 sqm of Gross Leasable Area (GLA).
The building features central air conditioning, raised flooring, a clear ceiling height of 2.65 meters, and a full-capacity backup generator serving 100% of the property. It is currently undergoing the LEED certification process.
Located just a few meters from Eldorado and Iguatemi shopping centers, the building is approximately 350 meters from Faria Lima metro station and offers convenient access to Rebouças Avenue and Marginal Pinheiros.
PORTFOLIO UPDATE
For Ed. BFL, the priority will be to advance the full retrofit scope of the property. The main workstreams include:
Comprehensive renovation of the lobby, ground-floor
area, and external landscaping;Implementation of an active frontage strategy and assessment of potential additional buildable rights; and
•
- Modernization of the building façade.
To enable the structured development of these initiatives, a budget allocation for the engagement of a design firm will be submitted for approval at the condominium meeting. The appointed firm will be responsible for preparing the asset’s masterplan.
Finally, a specific budget for investments aimed at aligning the building with the requirements necessary to obtain LEED certification will also be submitted for approval at the condominium meeting.

Portfolio
~~ED. GPA~~
Location: Av. Brigadeiro Luís Antônio, 3172 | Jardins % Ownership: 100%
Leasable Area (sqm): 11,224 LEED Certification: Not certified Classification: B
Ed. GPA is a Class B, single-tenant office building constructed in the 1990s. The asset is located on one of São Paulo’s main thoroughfares, at the intersection of Avenida Brigadeiro Luís Antônio and Alameda Lorena. The property benefits from a wide range of public transportation options, being approximately 900 meters from Brigadeiro metro station, and offers convenient access to the city’s main avenues. The building is situated in Jardim Paulista, one of São Paulo’s most prestigious and traditional neighborhoods. The headquarters is located next to the first Pão de Açúcar store, inaugurated in 1959, a landmark of historical relevance to the area.
PORTFOLIO UPDATE
During the month of January, the engagement of the technical consultant responsible for overseeing and validating the scope of Phase 2 of the property’s structural remediation was completed.
Over the next 60 to 90 days, the scope and related designs are expected to be validated among the relevant parties, with construction works anticipated to commence immediately thereafter.
~~ED. TOP CENTER~~
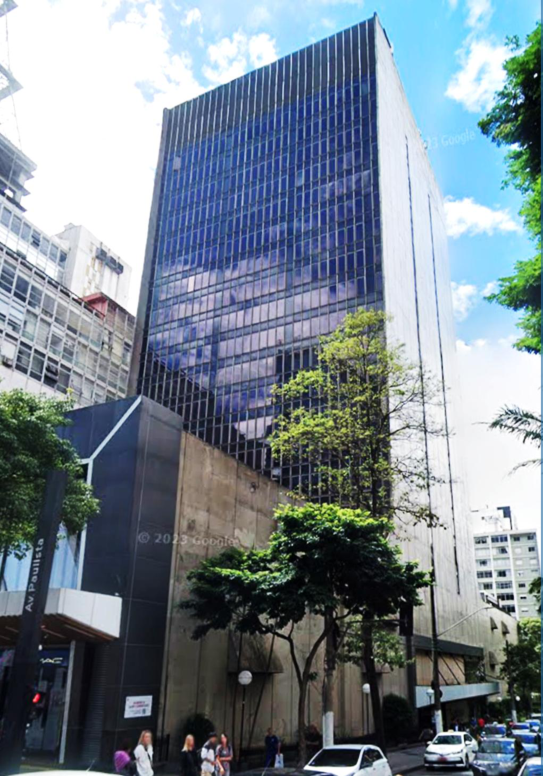
Location: Av. Paulista, 854 | Paulista % Ownership: 100%
Leasable Area (sqm): 11,224 LEED Certification: Not certified Classification: B

Top Center is a mixed-use complex comprising a Commercial Tower integrated with a shopping center, as well as a standalone parking structure serving the entire development. The Commercial Tower features 17 floors, with typical floor plates of approximately 792 sqm, allowing for multiple occupancy configurations and accommodating different tenant profiles.
Located between Avenida Paulista, Alameda Joaquim Eugênio de Lima, and Rua São Carlos do Pinhal, Top Center occupies a 3,948 sqm site and is close to key urban mobility hubs: approximately 500 meters from Brigadeiro station, 400 meters from Trianon-Masp station, and 1,300 meters from Consolação station.
PORTFOLIO UPDATE
In January, the main initiatives focused on appointing the company responsible for preparing the updated area statement in accordance with the BOMA/NBR methodology, as well as implementing commercial adjustments between the sub-condominiums. Additionally, a significant workstream was dedicated to budget restructuring and the hiring of new teams assigned to the commercial sub-condominium. The strategy to segregate condominium operations aims to enhance cost allocation efficiency, with an estimated reduction of approximately 35% in the commercial tower’s condominium fee.
In parallel, critical issues requiring priority interventions are being identified and assessed.
Financial Statements
~~INCOME STATEMENT~~

~~FUND NET ASSET VALUE COMPOSITION~~
| Dec/25 | Dec/25 | 2H25 | YTD | LTM | |||||||||
|---|---|---|---|---|---|---|---|---|---|---|---|---|---|
| (BRL/share) | (BRL ‘000) | (BRL ‘000) | (BRL ‘000) | (BRL ‘000) | 71,0 | ||||||||
| Rental Income | 0.073 | 3,909 | 21,582 | 42,526 | 42,526 | 627,4 | 4,8 | 0,9 | |||||
| Guaranteed Income | - | - | - | - | - | ||||||||
| Financial Income | 0.001 | 32 | 916 | 2,068 | 2,068 | -1407 | 9,7 | ||||||
| Other Income | 0.016 | 778 | 1,848 | 10,994 | 10,994 | , | |||||||
| Total Revenues | 0.089 | 4,420 | 24,346 | 51,174 | 51,174 | 474,3 | |||||||
| -97,8 | |||||||||||||
| Property Expenses | - | - | (180) | (247) | (247) | ||||||||
| Financial Expenses | (0.014) | (673) | (3,753) | (7,109) | (7,109) | ||||||||
| Operating Expenses | (0.001) | (69) | (644) | (1,077) | (1,077) | ||||||||
| Management, Administration and Custody Fee | (0.007) | (333) | (2,106) | (3,933) | (3,933) | ||||||||
| Total Expenses | (0.022) | (1,075) | (6,682) | (12,366) | (12,366) | ||||||||
| Management Adjustment – Accrual vs. Cash | - | - | - | 3,888 | 3,888 | ||||||||
| Net Income | 0.067 | 3,345 | 17,663 | 47,110 | 47,110 | ||||||||
| Opening Undistributed Earnings | 0,020 | 1.014 | 2.359 | 826 | 826 | ||||||||
| Net Income for the Period | 0,067 | 3.345 | 17.663 | 47.110 | 47.110 | ||||||||
| Total Result – Dividends Declared | (0,075) | (3.721) | (19.385) | (47.299) | (47.299) | Properties | Cash | REITs | Property | Property | Other | CRIs | Net Asset |
| Sales | Acquisitions | Assets | Payable | Value | |||||||||
| Closing Undistributed Earnings | 0,013 | 637 | 637 | 637 | 637 |
|] I CLICK HERE TO ACCESS TEPP11’S FUNDAMENTALS DATA SHEET I Po ~~DT~~
Projected Cash Flow
~~CASH FLOW PROJECTION (BRL MM)~~
100,00
80,00 60,00 40,00 20,00 ~~|~~ - ~~CH= e~~ ~~O~~ (20,00)
Projections indicate that the Fund has sufficient financial capacity to fully meet its obligations through September 2027, without the need for new share issuances or asset disposals. During this period, Management continues to assess the potential launch of a new issuance aimed at portfolio expansion, enabling capital raising at a more favorable time.
Additionally, part of the portfolio assets has already reached a more mature stage, which may allow for strategic disposals and the generation of cash proceeds for the Fund. Management highlights that the variations observed in the cash flow are primarily driven by updates to assumptions, revisions to income projections, and adjustments to the projected balances of the Fund’s liabilities. It is further noted that the amounts presented refer exclusively to the net cash position, excluding illiquid assets such as units of real estate investment funds.

~~ACQUISITIONS AND DISPOSALS~~
| Asset | Transaction Type | Amount (BRL MM) | Payment Method | Date |
|---|---|---|---|---|
| Ed. São Luiz | Disposal ¹ | 59,9 | Cash | feb-26 |
| Ed. GPA | Acquisition | -29,5 | Cash | mar-26 |
| Ed. Brigadeiro Faria Lima | Acquisition | -10,7 | Cash | mar-26 |
| Ed. Brigadeiro Faria Lima | Acquisition | -1,3 | Cash | mar-26 |
| Ed. Brigadeiro Faria Lima | Acquisition | -2,5 | Cash | sep-26 |
| Ed. Brigadeiro Faria Lima | Acquisition | -1,3 | Cash | mar-27 |
| Ed. Top Center | Acquisition | -62,2 | Share | jul-27 |
| Ed. Brigadeiro Faria Lima | Acquisition | -3,8 | Cash | sep-27 |
| Ed. Brigadeiro Faria Lima | Acquisition | -3,8 | Cash | sep-27 |
| Ed. Top Center | Acquisition | -29,5 | Cash | dec-27 |
¹Cash inflows already reflect the net capital gain amount. Future contractual adjustments to receivables and payables are not considered.
Finally, projections may be revised over time in light of new strategies or the occurrence of material events.
Consolidated Portfolio Overview

TELLUS “> >
mA
| ~~PORTFOLIO OVERVIE~~ | ~~W~~ | ||||||
|---|---|---|---|---|---|---|---|
| Ed. Passarelli UI | Ed. Brigadeiro Faria Lima Ed. Top 4 ÉS | Center Ed. GPA | Ed. | Fujitsu | TEPP11’ located i offi | s portfolio i n São Paulo ce submark | s100% ’s prime ets |
| ASSET e~~E~~ | CLASSIFICATION ~~RS ~~ | LEASEBLE AREA (sqm) ~~R~~ | TYPO VACANCY ~~S~~ | FINANCIAL VACANCY | % OWNERSHIP | NUMBER OF TENANTS | |
| Torre Sul | A | 9,950 | 5.5% | 1.13% | 18.6% | 10 | |
| Passarelli | B | 7,130 | 0.0% | 0.97% | 12.7% | 13 | |
| Fujitsu Em VILA OLÍMPIA | B | 4,985 | 0.0% | 0.00% | 8.3% | 3 | |
| MORUMBI | Brigadeiro Faria Lima o Rea Ê | B | 5,761 | 0.0% | 0.00% | 16.4% | 2 |
| Ed T Sl GPA Us e fa | B | 11,224 | 0.0% | 0.00% | 17.6% | 1 | |
| . orre u Top Center 3 | B | 13,463 | 18.2% | 11.06% | 26.4% | 18 | |
| Total | 52,514 | 5.7% | 2.3% | 100% | 47 |
MONTHLY MANAGEMENT REPORT | JANUARY 2026 Porfolio – Operating Indicators
~~REVENUE BY ASSET~~
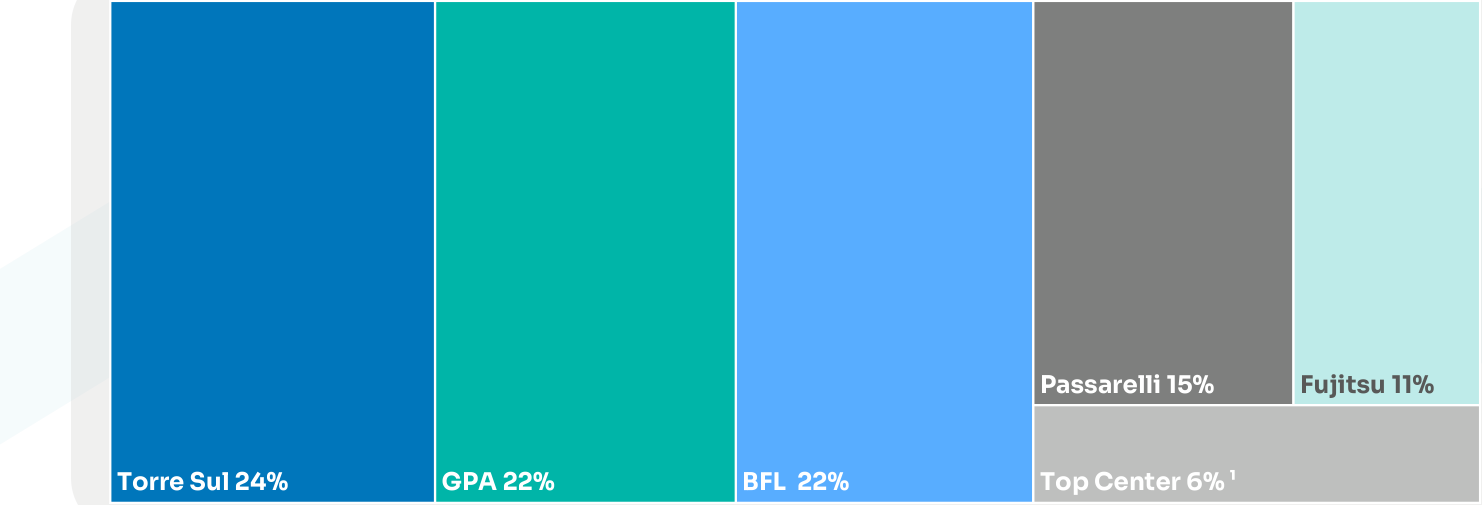
Passarelli 15% Fujitsu 11%
Torre Sul 24% GPA 22% BFL 22% Top Center 6% ¹
~~WAULT (YEARS)~~
Porfolio – Operating Indicators
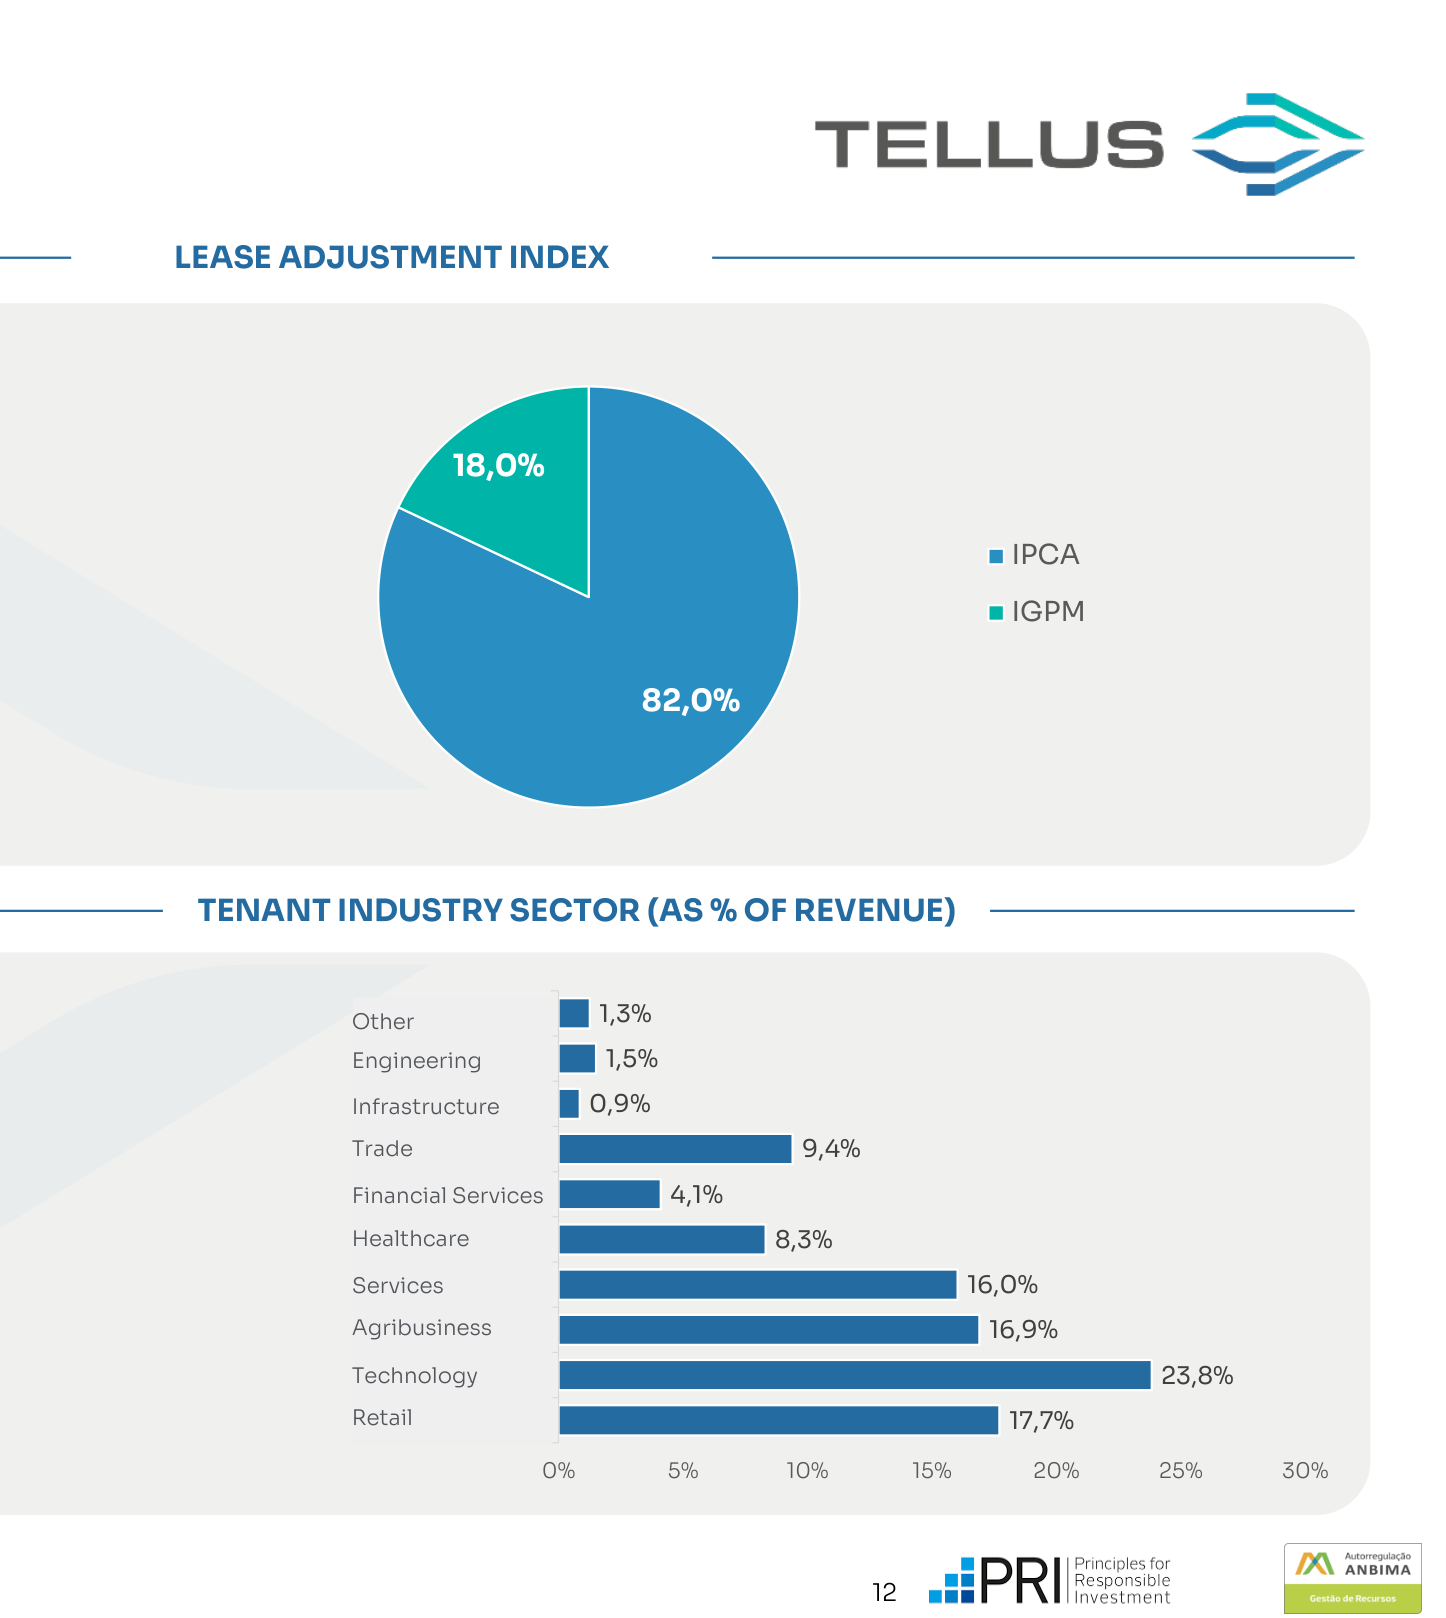
~~LEASE READJUSTMENT (% OF RENTAL REVENUES)~~

TELLUS SS
mA
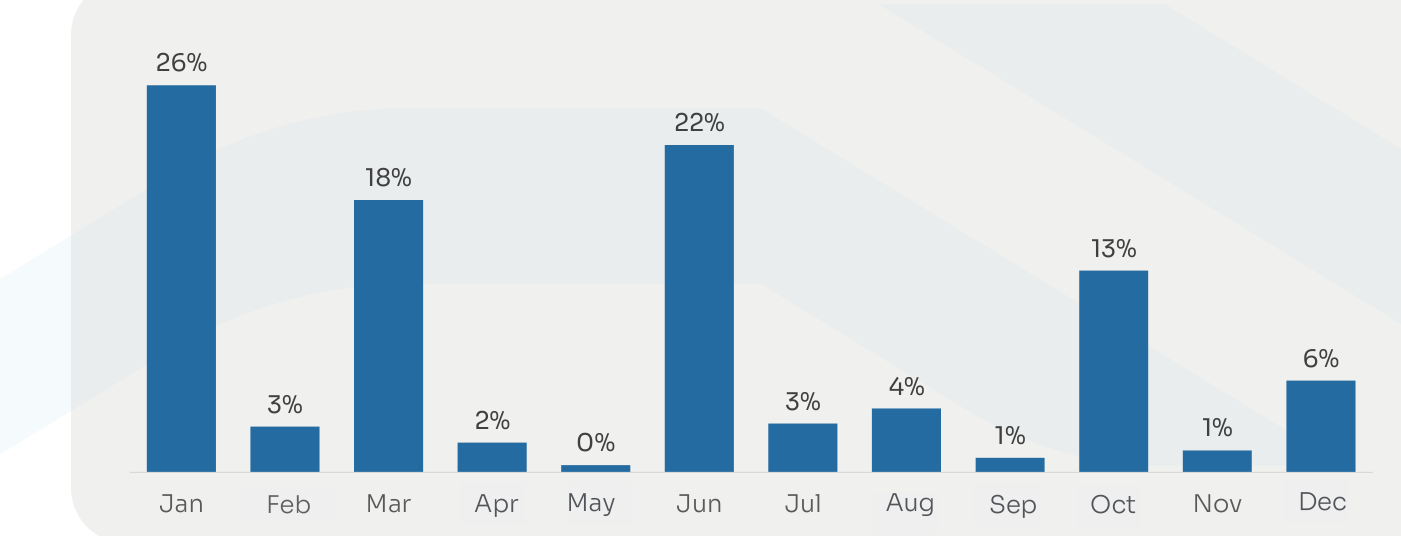
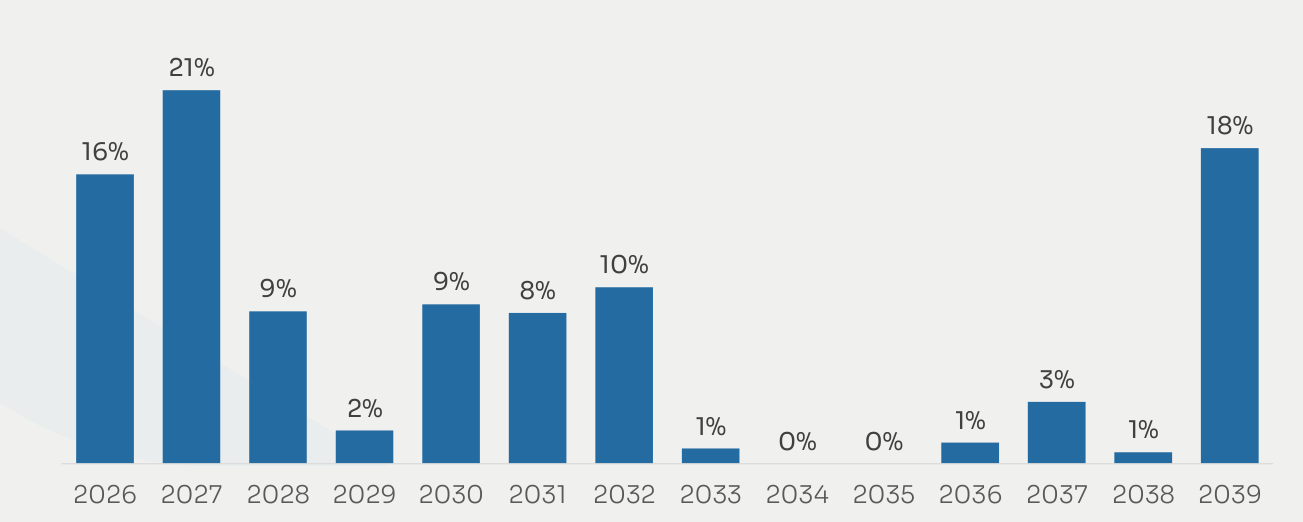
~~LEASE EXPIRATIONS (% OF RENTAL INCOME)~~
~~FINANCIAL & TYPO VACANCY EVOLUTION~~
~~DISTRIBUTION OF RENT REVIEWS (NUMBER OF CONTRACTS)~~


|MONTHLY MANAGEMENT REPORT | JANUARY 2026| |---|
| Porfolio – Operating Indicators |
|---|

| ~~OUTSTANDING FINANCIAL DEBT~~ |
|---|
| Issue Date Maturity Index | CRI FUJITSU Jun/21 Jun/33 IPCA | CRI GPA Dec/24 Dec/34 IPCA | 4,6% 13,1% 13, 1T21 2T21 3T Q Q Q dá sá á Pá ,; 4 r , , ! i i i i i i i i i i i i i ' i i i i i | 5% 14,6% 15,0% 21 4T21 1T22 Q Q | FU 15,6% 15,7% 2T22 3T22 Q Q | ND LEVERA 14,9% 15,1% 10 4T22 1T23 2 Q Q | GE TREND ,3% 10,3% 10,1 T23 3T23 4T Q Q Q | (% OF EQUI % 7,6% 7,7% 23 1T24 2T24 Q Q | TY) 7,8% 22,6% 23 3T24 4T24 1T Q Q Q | ,5% 24,0% 2 25 2T25 3T Q Q | 3,8% 20,3% 20,9% 25 4T25 1T26 Q Q 's, “a q ”, IN 1 1, 1 Y 1 1 1 1 1 1 1 1 1 1 1 1 1 1 1 1 1 1 1 1 |
|---|---|---|---|---|---|---|---|---|---|---|---|
| Interest Rate (p.y.) Payment Frequency | 6,00% Monthly | 8,17% Monthly | i i i i i i i i i i | DEBT | AMORTIZA | TION SCH | EDULE (BRL | MM) | 1 1 1 1 1 1 1 1 1 1 | ||
| Issued Amount (BRL) Updated Amount | 24,750,000 33,784,453 | 62,000,000 65,276,289 | i i i i i i i i i i i i | 8,37 | 8,55 | 8,73 | 8,93 | 9,12 | 9,32 | 9,52 | 9,73 1 1 1 1 1 1 1 1 1 1 1 1 |
| Amortization Start | Jul/26 | Jan/27 | 2,24 1 1 ' ' N ' k | 4,58 | 4,69 | 4,82 | 4,94 | 5,06 | 5,19 | 2,64 | 1 ] 1 1**)** 7 1 4 ~~EA~~ TA |
| 2026 a N ',, | 2027 | 2028 | 2029 | 2030 | 2031 | 2032 | 2033 | 2034 ~~;~~ ~~é~~ , | |||
| Number of Amortization Installments | 84 | 96 | sa “a “au | CRI m | Fujitsu C m | RI GPA | ~~á~~ ~~a~~ o o a |
|Tellus Properties FII |TEPP11| |---|
| 14 |
|---|

À1Y
Secundary Market
~~FUND UNITS TRADING ON B3~~
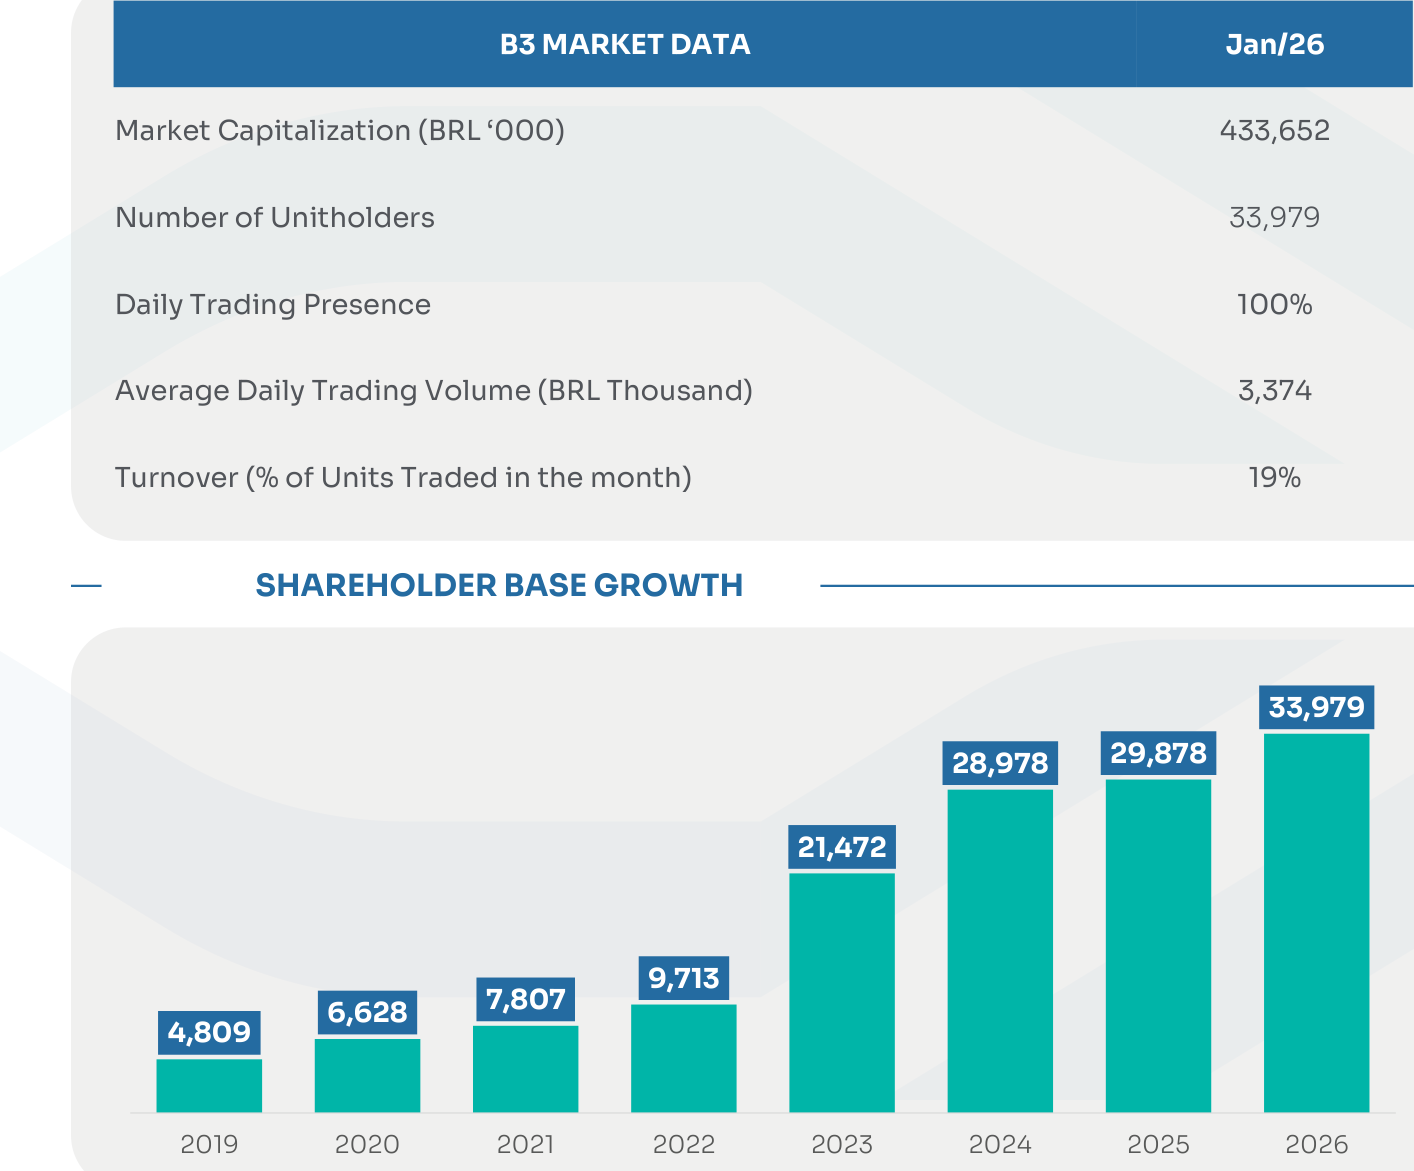
B3 MARKET DATA Jan/26
Market Capitalization (BRL ‘000) 433,652
Number of Unitholders 33,979
Daily Trading Presence 100%
Average Daily Trading Volume (BRL Thousand) 3,374
Turnover (% of Units Traded in the month) 19%
SHAREHOLDER BASE GROWTH
33,979
E
29,878
28,978
no GM
21,472
9,713
7,807
6,628
4,809
—S E DoE =
2019 2020 2021 2022 2023 2024 2025 2026
Performance

TELLUS <>
~~DISTRIBUTION HISTORY~~
| 2019 | 2020 | 2021 | 2022 | 2023 | 2024 | 2025 | 2026 | JAN | FEB | MAR | APR | MAY | JUN | JUL | AUG | SEP | OCT | NOV | DEC | Year | |||
|---|---|---|---|---|---|---|---|---|---|---|---|---|---|---|---|---|---|---|---|---|---|---|---|
| January | - | 0.055 | 0.050 | 0.047 | 0.049 | 0.064 | 0.080 | 0.075 | 2019 | TEPP11 | - | - | - | - | - | - | - | - | 0.0% | -0.6% | 2.2% | 11.1% | 12.8% |
| February | - | 0.056 | 0.045 | 0.047 | 0.050 | 0.064 | 0.095 | 0.075 | IFIX | - | - | - | - | - | - | - | - | 0.5% | 4.0% | 3.5% | 10.6% | 15.2% | |
| March | - | 0.049 | 0.045 | 0.049 | 0.051 | 0.100 | 0.095 | - | 2020 | TEPP11 IFIX | -2.7% -3.8% | -7.3% -3.7% | -9.2% -15.9% | 1.7% 4.4% | -4.8% 2.1% | 8.5% 5.6% | -1.6% -2.6% | 3.0% 1.8% | -2.2% 0.5% | -2.1% -1.0% | 1.2% 1.5% | 3.8% 2.2% | -12.3% -10.2% |
| April | - | 0.049 | 0.045 | 0.049 | 0.052 | 0.105 | 0.095 | - | TEPP11 | -1.0% | -1.7% | -2.4% | -1.6% | -5.1% | -0.7% | 4.5% | -10.5% | 2.7% | -4.6% | -5.3% | 14.8% | -12.1% | |
| May | - | 0.050 | 0.045 | 0.050 | 0.055 | 0.118 | 0.095 | - | 2021 | IFIX | 0.8% | -0.2% | -1.4% | 0.5% | -1.6% | -2.2% | 2.5% | -2.6% | -1.2% | -1.5% | -3.6% | 8.8% | -2.3% |
| June | - | 0.050 | 0.042 | 0.050 | 0.081 | 0.118 | 0.110 | - | TEPP11 | -1.7% | -2.1% | 0.0% | -0.1% | -2.0% | 0.6% | 6.0% | 15.3% | 3.3% | -2.6% | -8.0% | -10.1% | -3.1% | |
| 2022 | |||||||||||||||||||||||
| July | - | 0.052 | 0.038 | 0.049 | 0.058 | 0.078 | 0.091 | - | IFIX | -1.0% | -1.3% | 1.4% | 1.2% | 0.3% | -0.9% | 0.7% | 5.8% | 0.5% | 0.0% | -4.2% | 0.0% | 2.2% | |
| August | - | 0.050 | 0.045 | 0.049 | 0.058 | 0.078 | 0.074 | - | 2023 | TEPP11 | 3.7% | -2.2% | -0.1% | 11.3% | 10.8% | 9.8% | 1.3% | 1.1% | 4.2% | -1.2% | 4.1% | 0.0% | 48.6% |
| September | - | 0.050 | 0.048 | 0.049 | 0.058 | 0.078 | 0.074 | - | IFIX | -1.6% | -0.5% | -1.7% | 3.5% | 5.4% | 4.7% | 1.3% | 0.5% | 0.2% | -2.0% | 0.7% | 4.3% | 15.5% | |
| October | 0.027 | 0.047 | 0.048 | 0.050 | 0.064 | 0.078 | 0.074 | - | 2024 | TEPP11 | 1.5% | 1.0% | 5.7% | -1.5% | 1.6% | -2.4% | -0.6% | -0.4% | -1.3% | 0.7% | -4.5% | -2.1% | -1.8% |
| IFIX | 0.7% | 0.8% | 1.4% | -0.8% | 0.0% | -1.0% | 0.5% | 0.9% | -2.6% | -3.1% | -2.1% | -0.7% | -5.9% | ||||||||||
| November | 0.034 | 0.050 | 0.048 | 0.050 | 0.064 | 0.078 | 0.074 | - | TEPP11 | -4.9% | 7.8% | 5.8% | 6.1% | -4.4% | 2.3% | -1.4% | -2.3% | 5.8% | -2.6% | 6.2% | 2.1% | 18.2% | |
| December | 0.055 | 0.052 | 0.051 | 0.051 | 0.090 | 0.078 | 0.075 | - | 2025 | IFIX | -3.1% | 3.3% | 6.1% | 3.0% | 1.4% | 0.6% | -1.4% | 1.2% | 3.3% | 0.1% | 1.9% | 3.1% | 21.2% |
| Total Average | 0.116 0.290 | 0.610 0.051 | 0.550 0.046 | 0.590 0.049 | 0.730 0.061 | 1.037 0.086 | 1.032 0.086 | 0,150 0,075 | 2026 | TEPP11 IFIX | 1.6% 2.3% | - - | - - | - - | - - | - - | - - | - - | - - | - - | - - | - - | 1.6% 2.3% |
/>
CAGR = 17,16%
¹ Source: Broadcast
MONTHLY MANAGEMENT REPORT | JANUARY 2026 Timeline – Acquisitions and Disposals

TELLUS SS
mA
]]I IPO Tellus Properties (TEPP11) Aquisition - Ed. Cond. São Luiz Disposal - Ed. Cond. São Luiz II I BRL 26,5M (BRL 14.100/sqm) BRL 215,0M (BRL 16.314/sqm) III Aquisition - Ed. Cond. São Luiz Capital Gain: BRL 39.4M ~~|~~ I BRL 145M (BRL 12.833/sqm) I Aquisition - Ed. Fujitsu ] I ~~I~~ BRL 50M (BRL 10.030/sqm) ~~]~~ Aquisition - Ed. Brigadeiro Faria I Aquisition - Ed. Passarelli I ] Lima | BRL 63,42M (BRL 8.895/sqm) ~~II~~ BRL 95.0M (BRL 19.969/sqm) II ] I Aquisition - Ed. Torre Sul I] Aquisition - Ed. GPA I BRL 115M (BRL 11.176/sqm) I ] BRL 109,0M (BRL 9.710/sqm)
~~2019 2020 2021 2023 2024 2025~~

Aquisition - Ed. Brigadeiro Faria III Lima I| I BRL 12.6M (BRL 12.562/sqm) I|I Disposal - Ed. Timbaúba II I Aquisition - Ed. Timbaúba BRL 30.6M (BRL 13.072/sqm) Aquisition - Ed. Top Center BRL 26.5M (BRL 11.313/sqm) Capital Gain: BRL 1.8M BRL 167,4M (BRL 12.435/sqm)
TELLUS | The Manager
TELLUS is an independent asset management firm, with more than R$6.3* billion under management on real estate private equity. Since 2007, TELLUS has been active in all real estate sectors, with proven expertise in land entitlement, acquisition, development, redevelopment and value creation of office, industrial, mixed-use and for rent and for sale residential projects. We are committed with the transparency and fully integrated with our stakeholders. With an experienced and multidisciplinary team of professionals, TELLUS builds the capacity and agility to select assets to invest according to the different moments of the real estate market.

TELLUS SS
=

FII/REIT
PRIVATE FUNDS
| BRL 430,49 MM | TRBL11 | ||
|---|---|---|---|
| BRL 6,076 | Development of corporate, healthcare, residential, logistics, and mixed-use projects, primarily focused on the São Paulo market. | BRL 474,01 MM BRL 31,52 MM | TEPP11 TELM11 |
| BRL 49,76 | EDFO11. |
JK Square Itaim
Mixed-use project in a very well-located land plot at one of the best neighborhoods of São Paulo.
¹Source: TELLUS. Database: Dec./25
Tellus Properties FII | TEPP11 18
MONTHLY MANAGEMENT REPORT | JANUARY 2026 TELLUS | Gestora
Sustainability Commitment
Tellus became a signatory to the PRI (Principles for Responsible Investment) in 2021, reflecting its commitment to understanding and addressing the environmental, social, and governance (ESG) implications of its investment activities. Tellus’ assets incorporate a set of principles, values, and guidelines that support the management of its investments.Tellus believes that, in the management of third-party capital, the consideration of ESG factors in investment decisions contributes to improved risk management and the creation of long-term value for clients and society as a whole. The PRI is an investor initiative in partnership with the United Nations Environment Programme Finance Initiative (UNEP FI) and the UN Global Compact. It works alongside its international network of signatories to implement the six Principles for Responsible Investment. These Principles aim to promote the integration of ESG considerations into investment and ownership decisions and to support signatories in this process. In addition, Tellus incorporates relevant responsible investment practices as part of its fiduciary duty.
Tellus conducts ESG assessments across its investment portfolio, enabling a broader view of associated risks and opportunities. The Tellus ESG assessment framework combines both an integration approach and a best-in-class methodology.
Additional Information
TEPP11
Tellus Investimentos
Contact and Social Media
Email: [email protected]
Click Here
The integration approach consists of the systematic inclusion of ESG considerations in investment analyses and decision-making processes. Tellus performs this analysis through its due diligence procedures. If any environmental or other liabilities are identified, such as soil contamination, Tellus commits to implementing appropriate mitigation measures.
The best-in-class analysis is based on the Tellus ESG Score, which incorporates both ESG and financial criteria to evaluate each asset’s performance against environmental, social, and governance benchmarks. Tellus applies specific methodologies tailored to new developments, major refurbishments, and stabilized assets. After passing through these evaluation filters, each asset receives a final score with a corresponding adherence classification.

==“
res
Thank You!
+55 11 4280-4314 | [email protected] Av. Brigadeiro de Faria Lima, 2179 10º floor I São Paulo – SP 01452-001