
Relatório Gerencial IBBP11 de setembro de 2026
Relatório Gerencial do Invista Brazilian Business Park (IBBP11), fundo imobiliário de logística, referente a setembro de 2026, com entrega no FundosNet (B3) em 13/10/2026. No pregão de 03/11/2026, a cota do IBBP11 fechou a R$ 7,99, com P/VP de 0,60 (valor patrimonial de R$ 13,24 por cota no informe mensal de setembro de 2026). O último rendimento foi de R$ 0,0841 por cota, com pagamento em out/2026, e o dividend yield dos últimos 12 meses é de 10,88% sobre a cotação de 03/11/2026. O patrimônio líquido era de R$ 997,8 milhões no informe mensal de setembro de 2026. Os indicadores são os mais recentes da base do Kartac, não os do período do documento.
Informações
- Fundo
- INVISTA BRAZILIAN BUSINESS PARK -1,72%
- CNPJ
- 52.551.605/0001-74
- Tipo
- Relatórios
- Assunto
- Relatório Gerencial
- Data de referência
- 30/09/2026
- Data de entrega
- 13/10/2026 19:45
- Versão
- 1
- Situação
- (Inativo)
Conteúdo
September | 2026
FUND OVERVIEW
inVista Brazilian Business Park FII Position as of · September | 2026
TOTAL NET ASSETS (R$)
997.8 M
12-MONTH DIVIDEND YIELD
11.60%
TOTAL NUMBER OF UNITHOLDERS
2,266
SUBORDINATED CLASS
MARKET CAP (R$)
612.8 M
MARKET PRICE PER UNIT (R$)
8.13
DISTRIBUTION PER UNIT (R$)
0.0841
NET ASSETS (R$)
703.2 M
BOOK VALUE PER UNIT (R$)
9.33
MONTHLY DIVIDEND YIELD (ANNUALISED)¹
12.41%
NUMBER OF UNITHOLDERS
2,262
P/BV
0.87 x
NUMBER OF UNITS
75,370,655
SENIOR CLASS
NET ASSETS (R$)
294.5 M
DISTRIBUTION PER UNIT (R$)
0.091
BOOK VALUE PER UNIT (R$)
11.02
MONTHLY DIVIDEND YIELD (ANNUALISED)¹
11.80%
NUMBER OF UNITHOLDERS
4
NUMBER OF UNITS
26,721,829
¹ Subordinated Class: Figures relative to the market price at month-end | Senior Class: Figures relative to the weighted average issue price per unit since inception (R$ 9.26/unit).

MARKET OVERVIEW
LISTED REAL ESTATE FUNDS AND THE INDUSTRIAL/LOGISTICS SEGMENT
The IFIX ended September 2026 down 0.2% month-on-month, extending the correction observed in recent months and relinquishing part of its year-to-date gains, which returned the index to levels close to those recorded in December 2025. During the month, the Central Bank's Monetary Policy Committee (Copom) reduced the Selic rate by 25 basis points to 13.75% per annum, in line with the easing path already priced into the yield curve. Notwithstanding the rate cut, market sentiment remained cautious, chiefly in view of the ongoing expansion of fiscal and credit stimulus, persistent pressure on current inflation and the proximity of the first round of the general elections, factors that sustained elevated risk premiums. Industrial and logistics funds tracked the broader index but posted a more contained decline, preserving a positive year-to-date return and reaffirming the segment's comparatively defensive profile among brick-and-mortar funds.
The volatility observed in the listed market stands in contrast to the soundness of the segment, whose operating fundamentals remain robust. Vacancy in high-specification warehouses in Brazil has reached a historic low, demand continues to be underpinned by the expansion of e-commerce, and competition for prime assets supports lease renewals and rental adjustments. Together with long-term lease agreements, high-quality assets and a diversified tenant base, these factors provide a high degree of visibility over the segment's revenues. Units currently trade at a meaningful discount to net asset value and offer an annualised dividend yield of approximately 10.5% on book value, a combination that enhances the riskreturn profile and broadens the scope for appreciation over the medium term.
UPDATES — SEPTEMBER 2026
In September 2026, IBBP11 — inVista Brazilian Business Park FII announced distributions of R$ 0.091 per senior unit and R$ 0.0841 per subordinated unit, payable on 15 October and 16 October, respectively, to unitholders of record on 7 October. The distribution remains in line with the fund's financial plan and with its revenue and cash projections for the coming months.
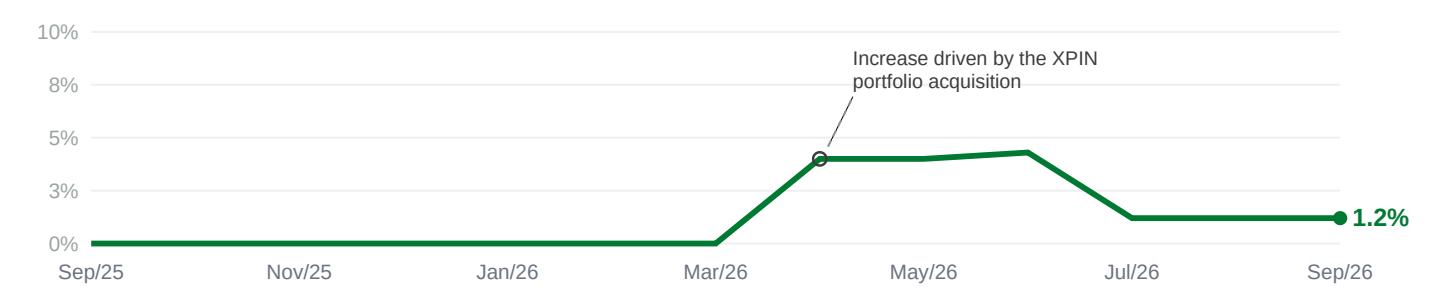
The fund closed the month with physical vacancy of 1.3% of GLA — equivalent to 98.7% occupancy — a high level for a fund with an industrial profile, underlining the quality of its assets and tenant base. Complexo Gaia, Centro Empresarial Atibaia and Extrema are fully occupied, followed by Condomínio Barão de Mauá (93.5%). Vacant space totals 3,132 sqm, concentrated in the properties acquired from XPIN11, and negotiations with prospective tenants continue to progress well, with talks at an advanced stage.
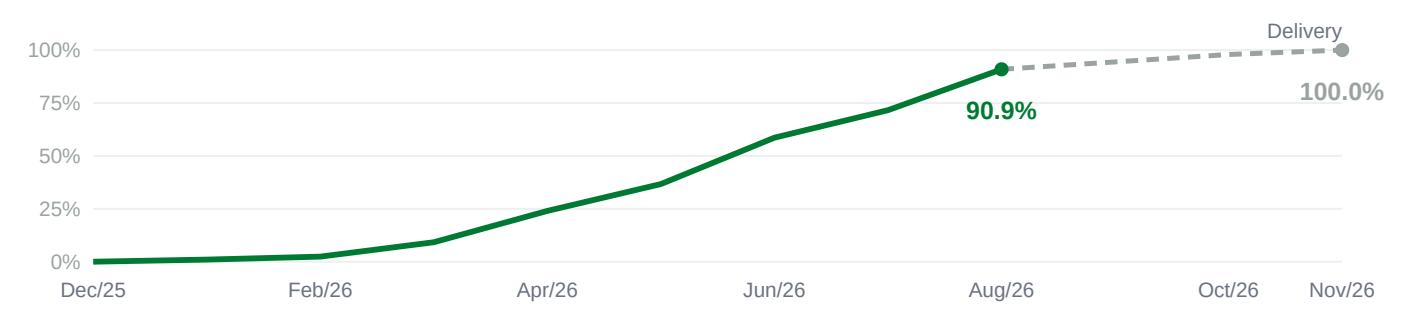
Construction of the Jequitibá and Jacarandá buildings at Complexo Gaia continues at a good pace: physical progress reached 90.9%, ahead of the budgeted schedule, with delivery expected in November 2026. The buildings will be leased to MCassab under a 17,656 sqm contract, indexed to IPCA and maturing in October 2041.
With net assets of R$ 997.8 million, occupancy at high levels, advanced negotiations for the remaining space and construction ahead of schedule, IBBP11 trades at 0.87x book value and is on track to eliminate its vacancy, consolidating its position as the leading industrial real estate fund on the Brazilian exchange.

THE BRAZILIAN BUSINESS PARK
OVERVIEW
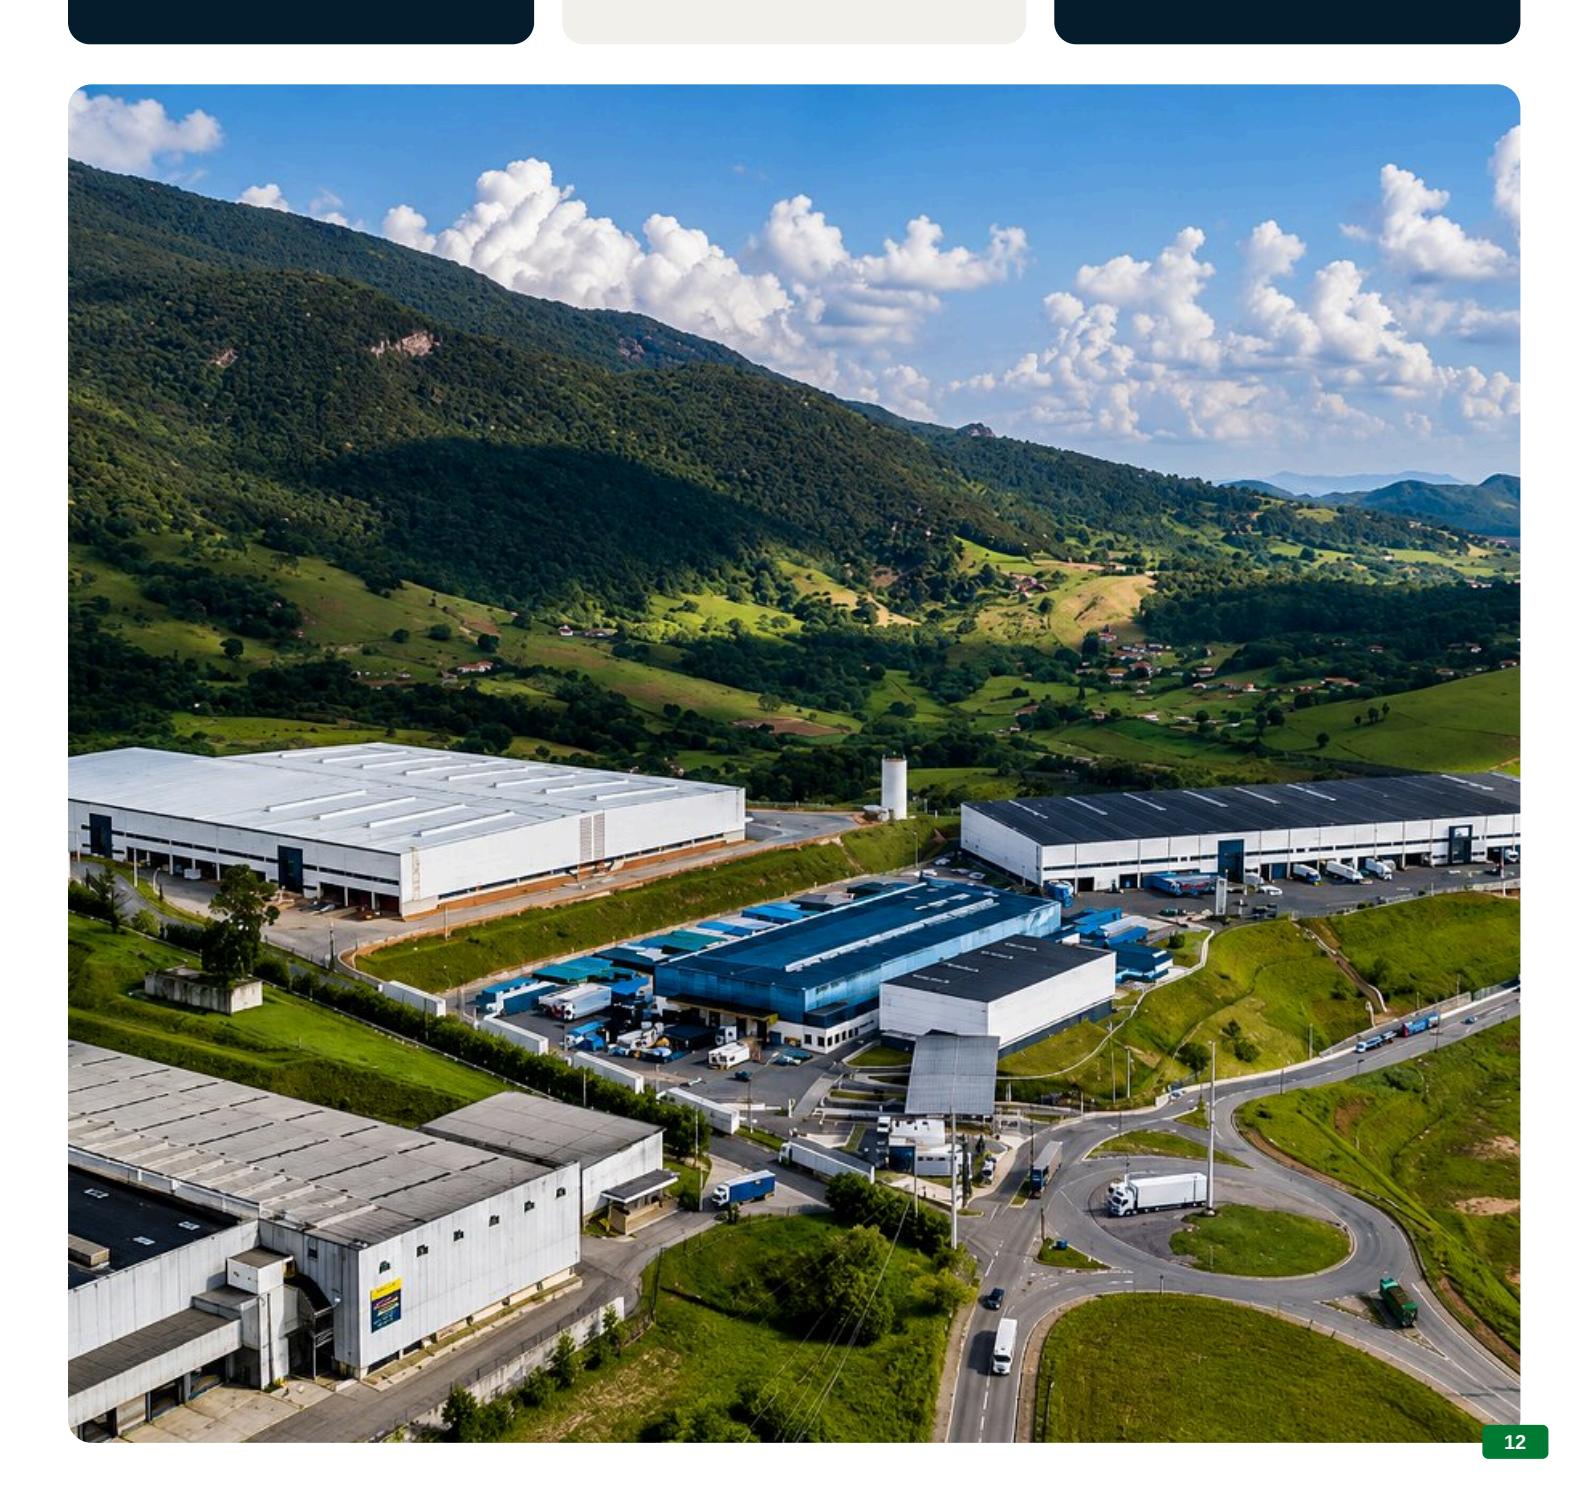
BBP (Brazilian Business Park) is one of the largest industrial complexes in Latin America, and all of its parks sit in prime locations along São Paulo's main highways — Bandeirantes, Dom Pedro I, Anhanguera and Fernão Dias. The company has been developing and building industrial cities for more than 30 years, giving its tenants privileged access to power, telecommunications, environmental management, water and sewage infrastructure, among other value-added services. This structure is based on a plug & play format, allowing manufacturers to move in quickly and stay focused on their core operations while BBP takes care of everything else.
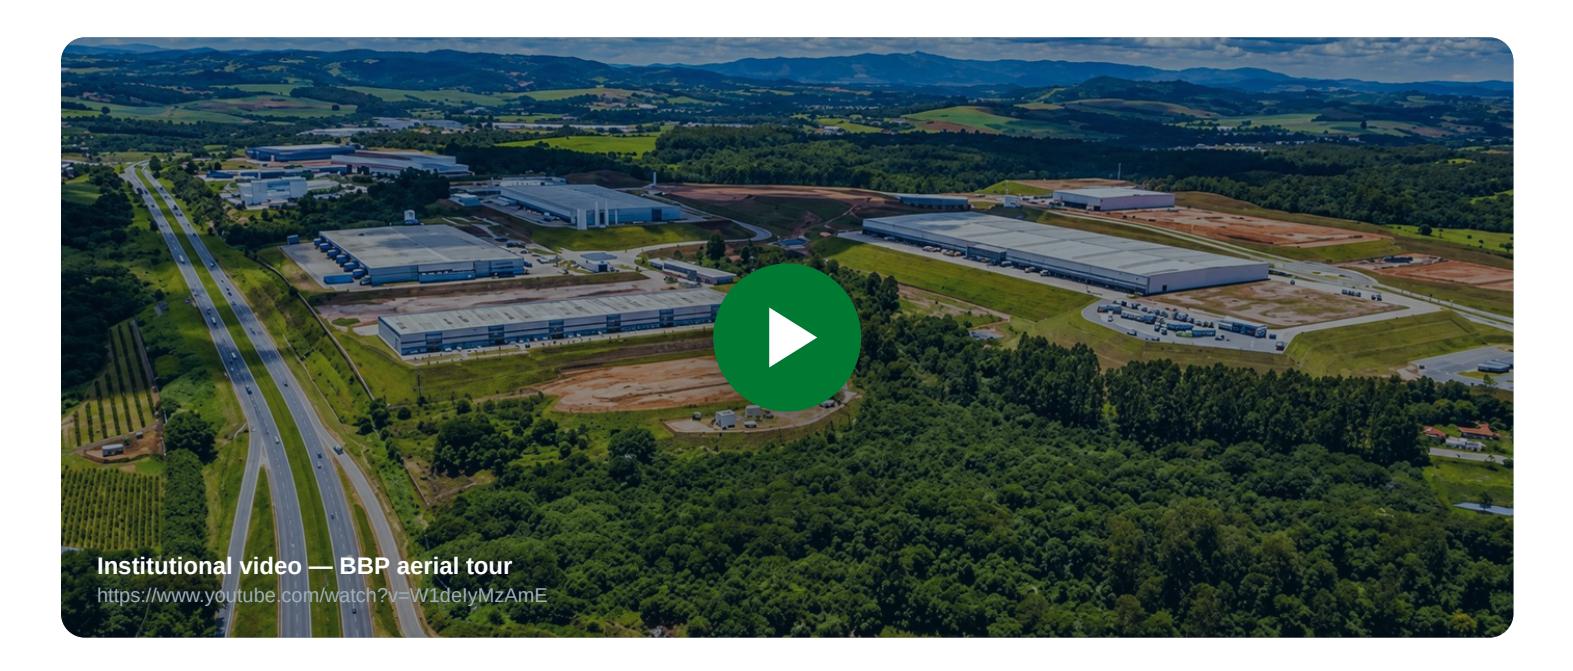
To give unitholders a closer look at the infrastructure of the BBP parks, we invite you to watch the institutional video, which offers an aerial tour showing the construction quality, the high logistics standard and the quality of the areas that host major domestic and multinational operations.

CURRENT POSITIONING
inVista Brazilian Business Park FII is a real estate investment fund whose objective is to generate income and capital gains by developing industrial and logistics warehouses built by BBP for subsequent lease and/or sale.
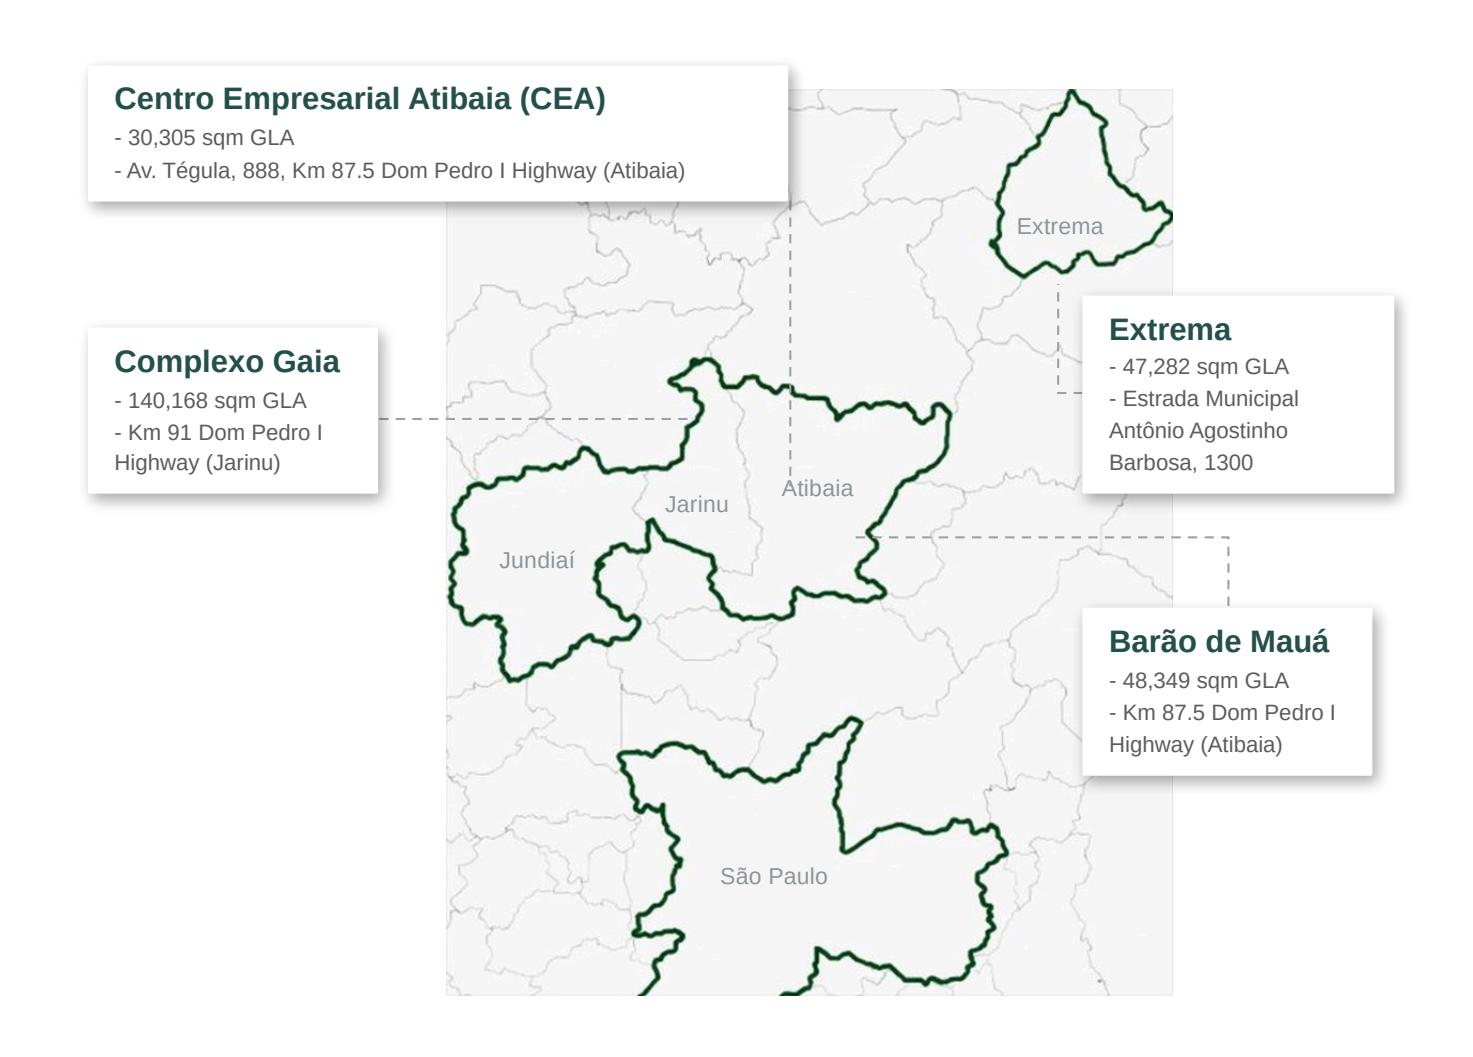
The fund holds interests in the Barão de Mauá, Centro Empresarial Atibaia, Complexo Gaia and Extrema/MG parks, all equipped with shared infrastructure that supports the operating performance of the companies installed there. The parks lie within a 500 km radius — one day of freight distribution — of the metropolitan regions that together account for approximately 60% of Brazil's GDP.
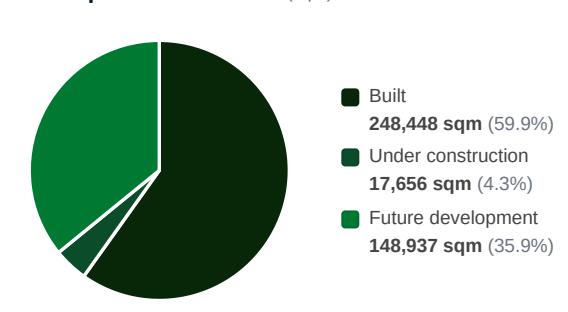
With a total GLA of 248 thousand sqm built and 17 thousand sqm under construction (scheduled for delivery in the fourth quarter of 2026), the portfolio is leased to multinational companies of very high credit quality. The fund also holds 149 thousand sqm of development pads for future projects.
- 98.7% physical occupancy across the properties
- 95.5% of rent collected on time in September 2026
- Weighted average lease maturity of 6.7 years
- Revenue diversified across 31 tenants.

PORTFOLIO COMPOSITION
Physical Composition % of GLA by property
/>
Tenant Countries Leased GLA (sqm)
| 44.2% | 11.4% | 11.1% | 9.3% | 7.5% | 5.8% | |||
|---|---|---|---|---|---|---|---|---|
| Brazil — 116,103 sqm (44.2%) | Mexico — 15,297 sqm (5.8%) | |||||||
| Italy — 30,022 sqm (11.4%) | China — 8,074 sqm (3.1%) | |||||||
| United States — 29,173 sqm (11.1%) | Taiwan — 8,030 sqm (3.1%) | |||||||
| Germany — 24,329 sqm (9.3%) | South Korea — 6,752 sqm (2.6%) | |||||||
| Canada — 19,612 sqm (7.5%) | Japan — 5,581 sqm (2.1%) | |||||||
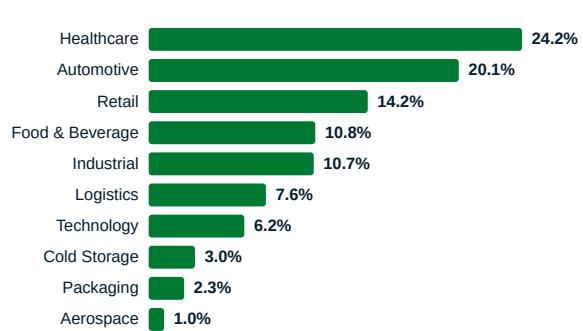
Tenant Industries % of GLA
Development Status GLA (sqm)
Physical Vacancy % of GLA
Construction — Physical Progress

INCOME STATEMENT
| (R$ thousand, unless stated otherwise) Sep/26 3 Months 2026 Properties — Rental income 5,800.8 17,184.3 41,999.5 Properties — Gains on sales² 486.3 6,516.4 8,707.6 REIT — Distributions received 3,529.3 5,879.5 11,072.8 Financial investments 234.2 329.9 12,451.7 Total revenues 10,050.6 29,910.1 74,231.6 Operating expenses (1,469.7) (5,487.5) (16,063.5) Net income 8,580.9 24,422.5 58,168.0 Distributions³ (10,794.3) (28,400.2) (62,071.8) 0.0841 0.2503 0.7092 Subordinated (R$/unit) Senior (R$/unit) 0.0910 0.2812 0.7924 | ||||
|---|---|---|---|---|
| 12 Months | ||||
| 49,301.6 | ||||
| 8,707.6 | ||||
| 15,128.7 | ||||
| 12,936.5 | ||||
| 86,074.3 | ||||
| (18,558.0) | ||||
| 67,516.3 | ||||
| (66,882.8) | ||||
| 0.9459 | ||||
| 1.0324 | ||||
| Retained earnings reserve | 1,270.5 |
² The Properties — Gains on sales line includes gains realised on the disposal of units in other listed real estate funds.
DISTRIBUTION HISTORY — SUBORDINATED⁴
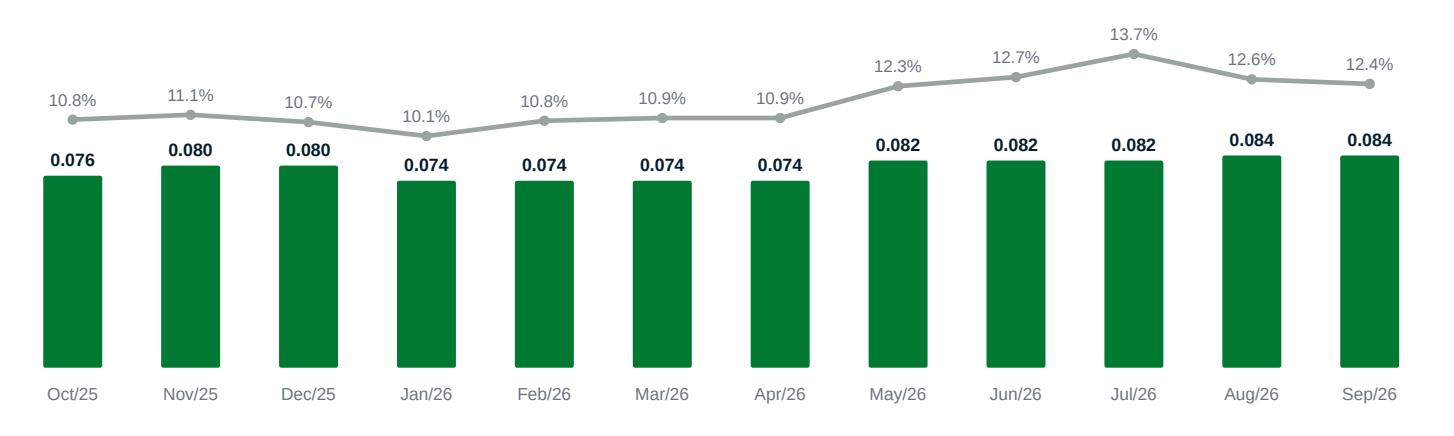
Distribution per Unit (R$) Dividend Yield
DISTRIBUTION HISTORY — SENIOR⁴
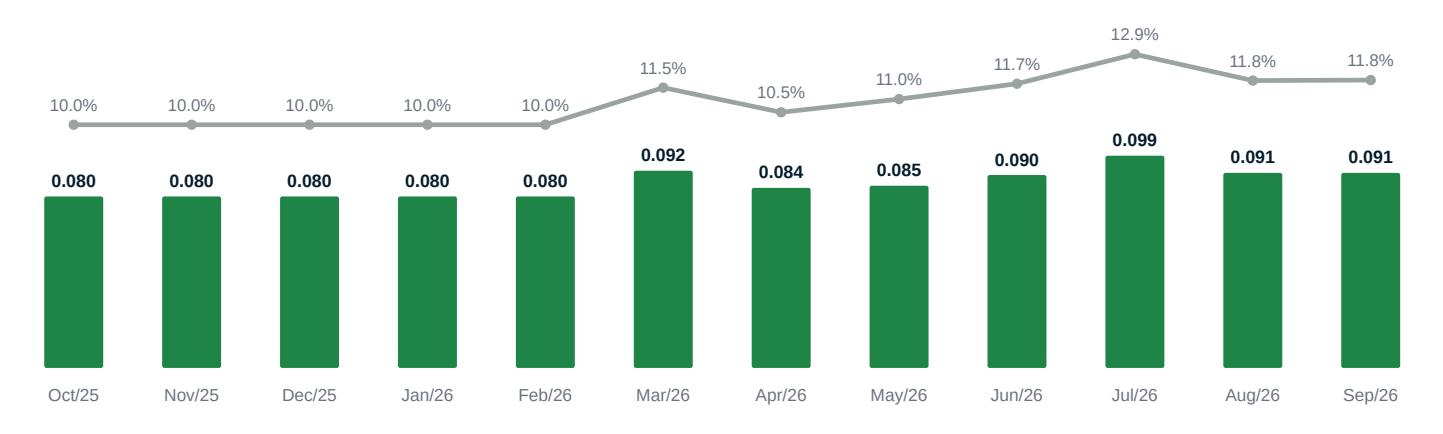
Distribution per Unit (R$) Dividend Yield
³ Distribution figures also include income paid to holders of subscription receipts from the 6th Offering.
⁴ Subordinated Class: Figures relative to the market price at month-end | Senior Class: Figures relative to the weighted average issue price per unit since inception (R$ 9.26/unit).

GROSS-UP DIVIDEND YIELD VS. NTN-B5
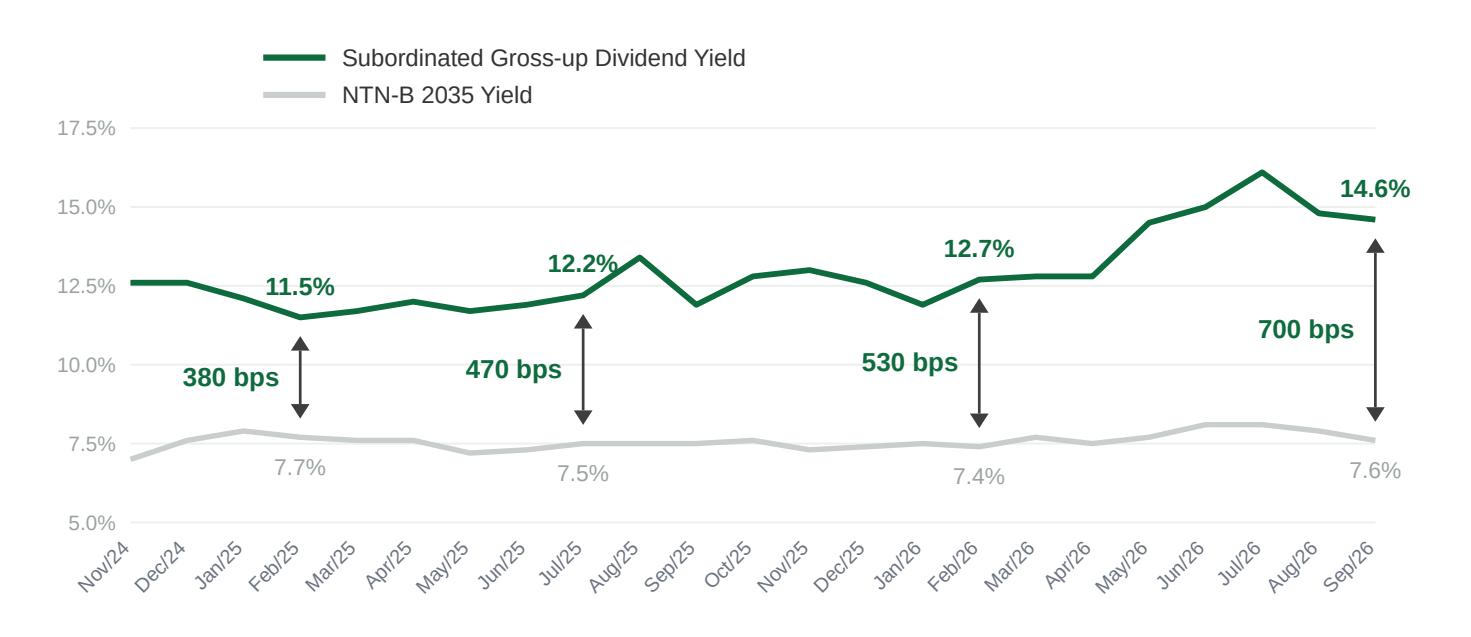
& lt;sup>5</sup> The gross-up dividend yield assumes a 15% income tax rate.
PERFORMANCE
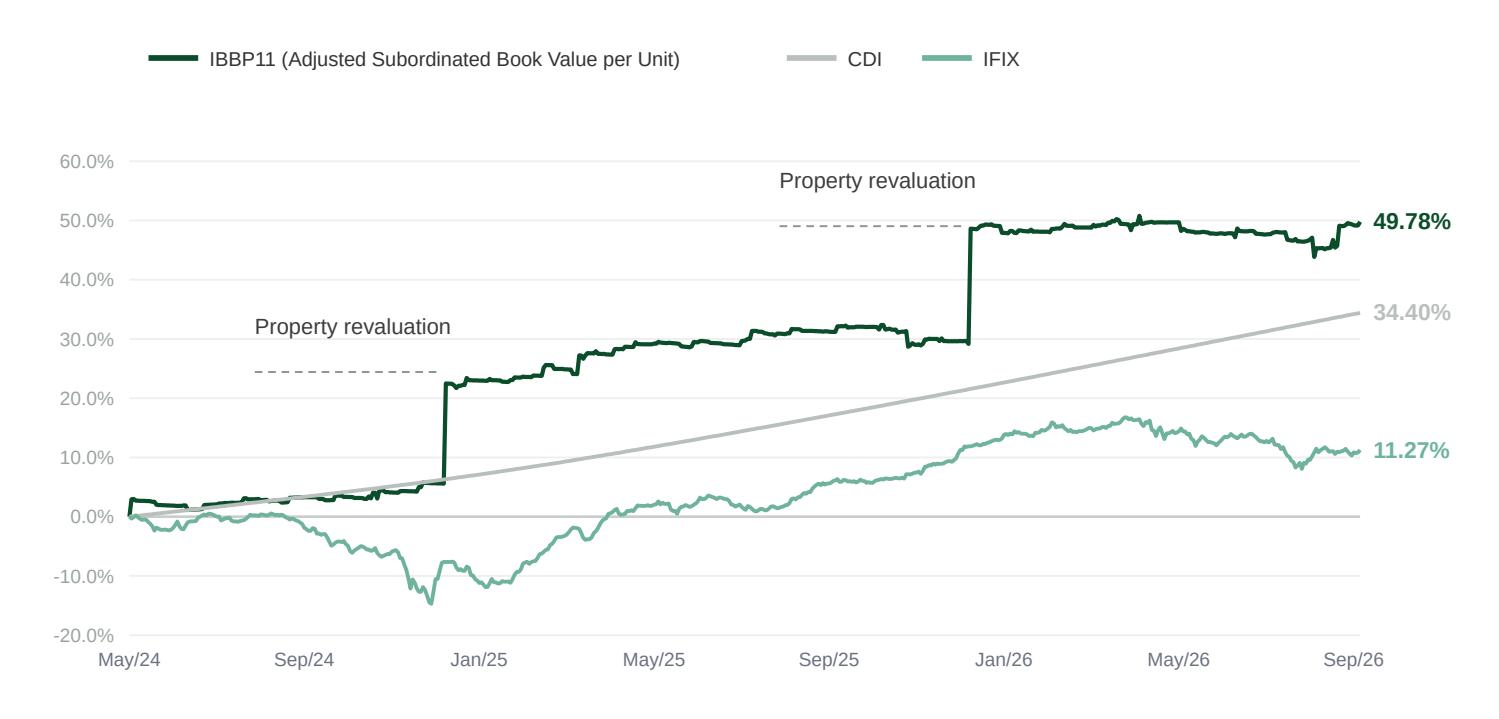
Return on the subordinated book value per unit, adjusted for distributions, compared with the CDI and IFIX benchmarks over the same period. Past performance is no guarantee of future results.

LEASE SCHEDULE
| SBF (Centauro) Jarinu 34,508 Retail IGPM December-2027 13.0% Sogefi Jarinu 23,790 Automotive IPCA August-2034 8.9% Solventum Jarinu 23,787 Healthcare IPCA September-2040 8.9% MCassab Jarinu 17,656 Food & Beverage IPCA October-2041 6.6% Petfive Jarinu 13,734 Healthcare IPCA May-2040 5.2% Magna Jarinu 10,734 Automotive IPCA February-2034 4.0% Johnson Industrial Jarinu 8,030 Healthcare IPCA July-2034 3.0% Natural One Jarinu 7,930 Food & Beverage IPCA December-2032 3.0% Complexo Gaia 140,168 52.7% 5 countries Hanon Atibaia 6,752 Automotive IPCA January-2030 2.5% Intercos Atibaia 6,232 Healthcare IPCA December-2039 2.3% Norma Atibaia 5,845 Industrial IGPM October-2028 2.2% Litens Atibaia 5,769 Automotive IPCA March-2030 2.2% Rema Tip Top Atibaia 3,116 Industrial IPCA April-2030 1.2% Litens Atibaia 3,109 Automotive IPCA March-2030 1.2% APS Atibaia 2,693 Aerospace IPCA April-2030 1.0% Viskase Atibaia 2,693 Food & Beverage IPCA July-2027 1.0% Dekra Atibaia 2,666 Automotive IPCA February-2034 1.0% Ismafer Atibaia 2,492 Industrial IPCA October-2029 0.9% Fricke Atibaia 1,347 Industrial IPCA April-2034 0.5% Garopaba Atibaia 1,170 Logistics IPCA August-2027 0.4% Bruker Atibaia 1,040 Healthcare IPCA February-2031 0.4% G.A.W Atibaia 292 Logistics IPCA August-2027 0.1% Vacant Atibaia 3,132 - - - 1.2% Condomínio Barão de Mauá 48,349 18.2% 6 countries Smart Atibaia 6,400 Technology IGPM June-2032 2.4% SPLack Atibaia 6,060 Packaging IGPM June-2034 2.3% Linuo Atibaia 5,262 Healthcare IPCA June-2031 2.0% Smart Atibaia 5,262 Technology IPCA June-2032 2.0% Constanta Atibaia 4,530 Technology IPCA March-2028 1.7% Terumo Atibaia 2,792 Healthcare IPCA October-2027 1.0% Centro Empresarial Atibaia 30,305 11.4% 4 countries Acqualimp Extrema 15,297 Industrial IPCA January-2031 5.7% Volo Extrema 10,503 Logistics IPCA November-2030 3.9% D2 Extrema 8,042 Logistics IPCA June-2032 3.0% Ar Frio Extrema 7,839 Cold Storage IPCA November-2033 2.9% Huawei Extrema 2,812 Retail IPCA January-2028 1.1% Terumo Extrema 2,789 Healthcare IPCA May-2027 1.0% Extrema 47,282 17.8% 4 countries | Tenant | City | GLA (sqm) | Industry | Index | Maturity | Country | % of GLA |
|---|---|---|---|---|---|---|---|---|

COMPLEXO GAIA
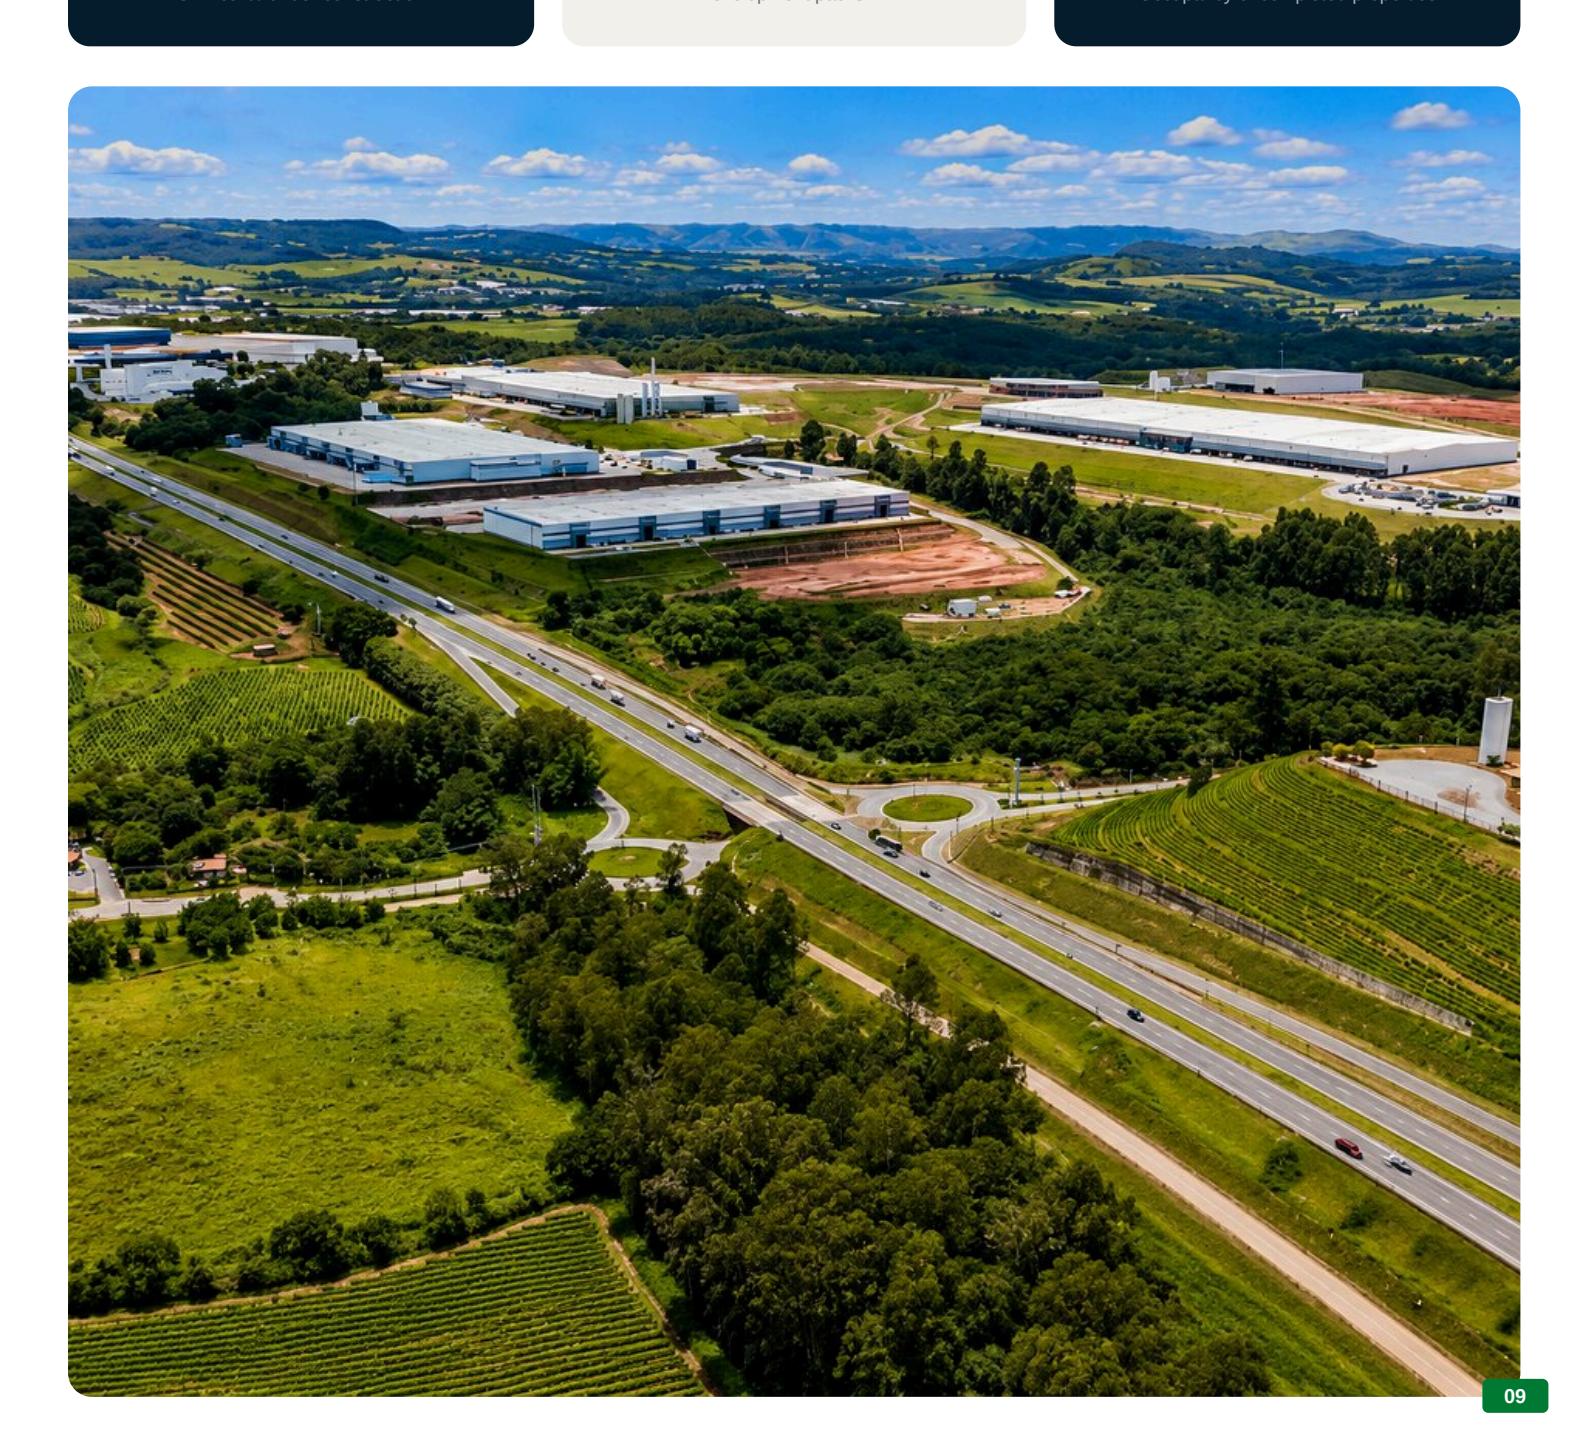
BBP - Complexo Gaia is located at km 91 of the Dom Pedro I Highway in Jarinu, São Paulo, occupying a total site of 5,114,281 sqm with 904,385 sqm of leasable area. The park offers a range of adaptable spaces to meet the specific needs of each company. The project follows the BBP standard of sustainability and innovation, integrating advanced ecological and technological solutions. Its strategic location also provides easy access to Brazil's main road, air and port distribution routes.
140,168 sqm
GLA built / under construction
148,937 sqm
Development pad GLA
100%
Occupancy of completed properties

CONDOMÍNIO BARÃO DE MAUÁ
BBP - Condomínio Barão de Mauá is located at km 87.5 of the Dom Pedro I Highway in Atibaia, São Paulo, with easy access to major commercial and industrial hubs. The park covers a total site of 448,430 sqm, of which 122,948 sqm is leasable area, offering large and adaptable spaces for companies' operating requirements. The infrastructure is complete and flexible, allowing spaces to be tailored to each business.
48,349 sqm
GLA built / under construction
— Development pad GLA
93.5% Occupancy of completed properties

CENTRO EMPRESARIAL ATIBAIA
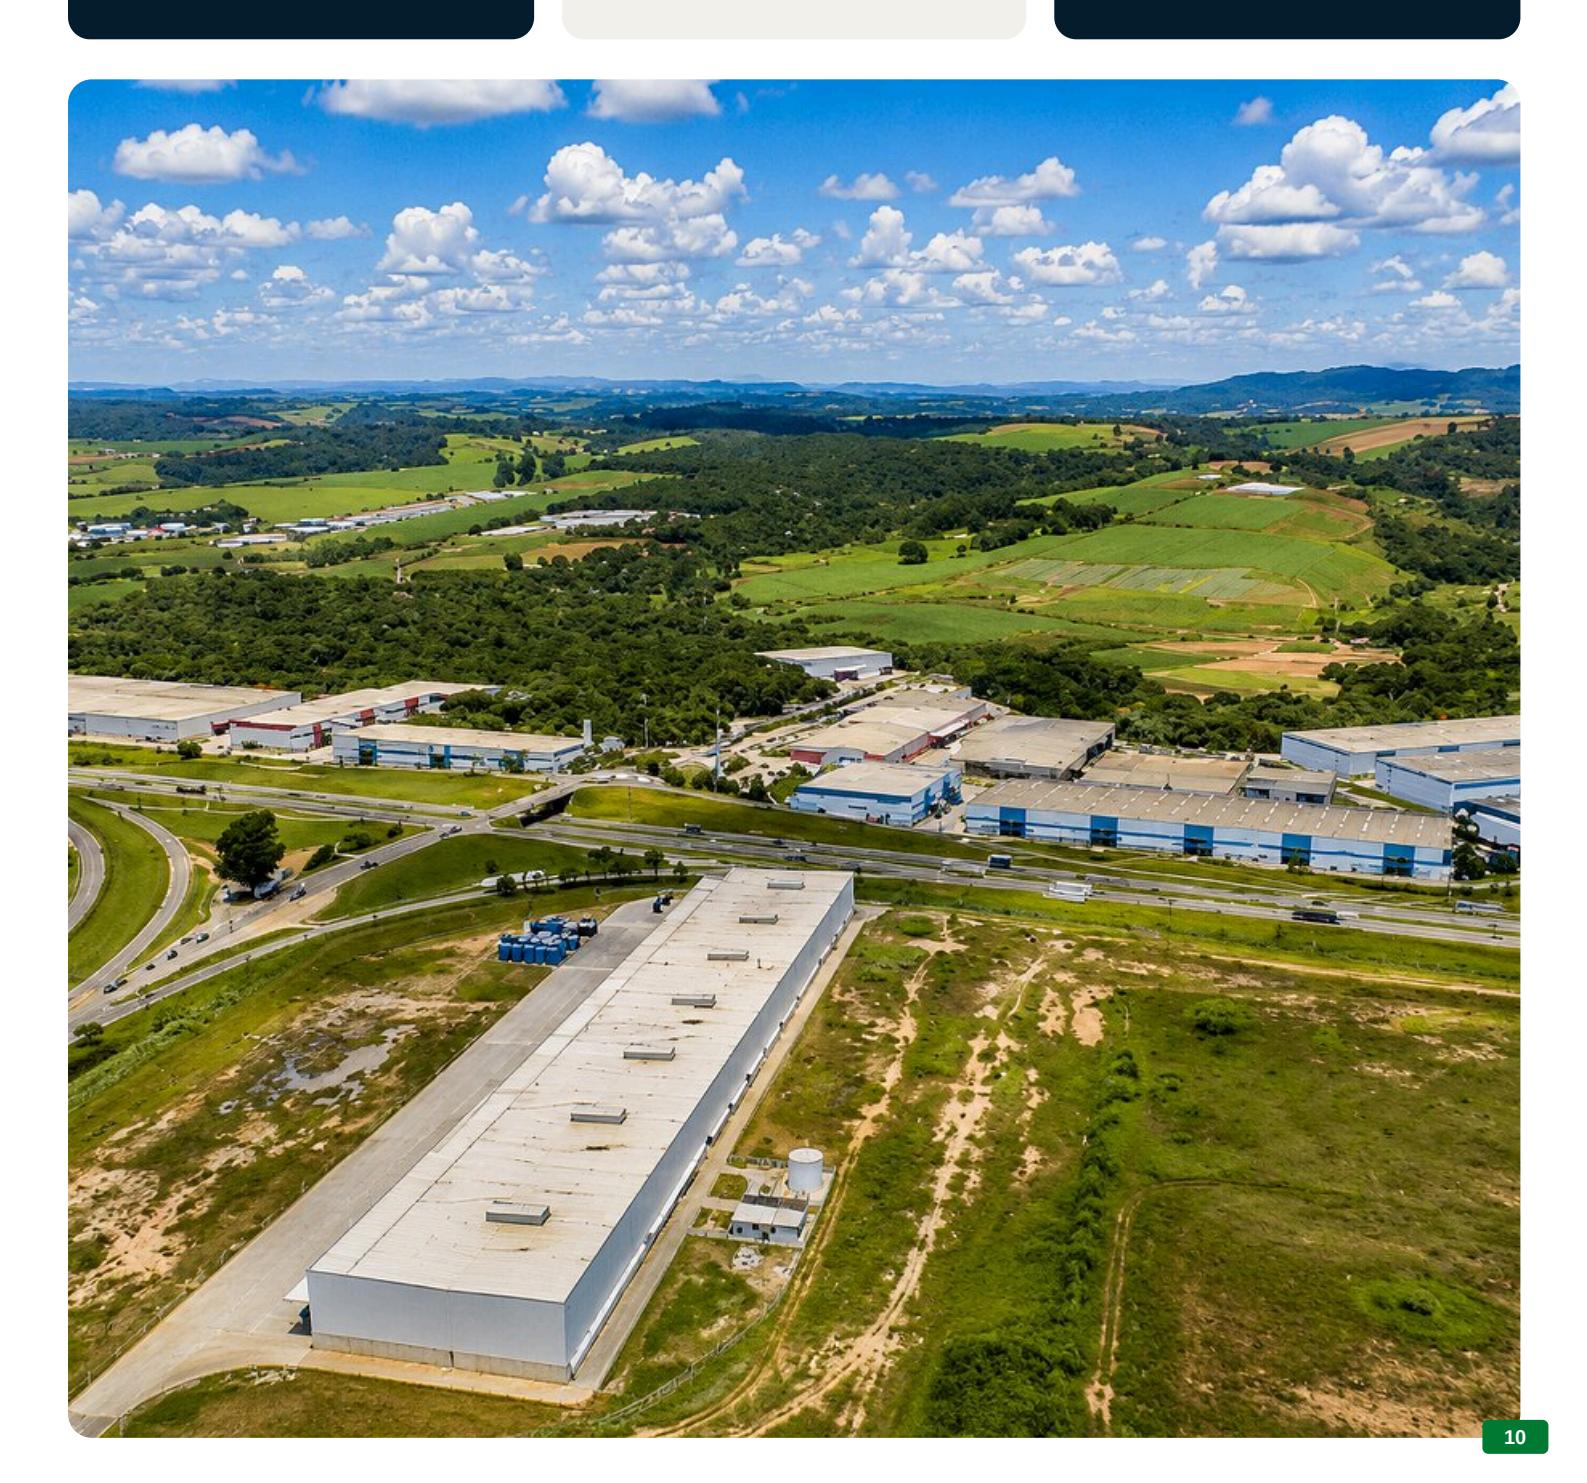
BBP - Centro Empresarial Atibaia is located at Av. Tégula, 888, in Atibaia, São Paulo, near km 87.5 of the Dom Pedro I Highway. The park occupies a total site of 91,355 sqm, of which 48,690 sqm is leasable area, and offers adaptable spaces for the specific needs of each company. The facilities are equipped with advanced technology to foster innovation and productivity.
30,305 sqm
GLA built / under construction
— Development pad GLA
100%
Occupancy of completed properties

EXTREMA
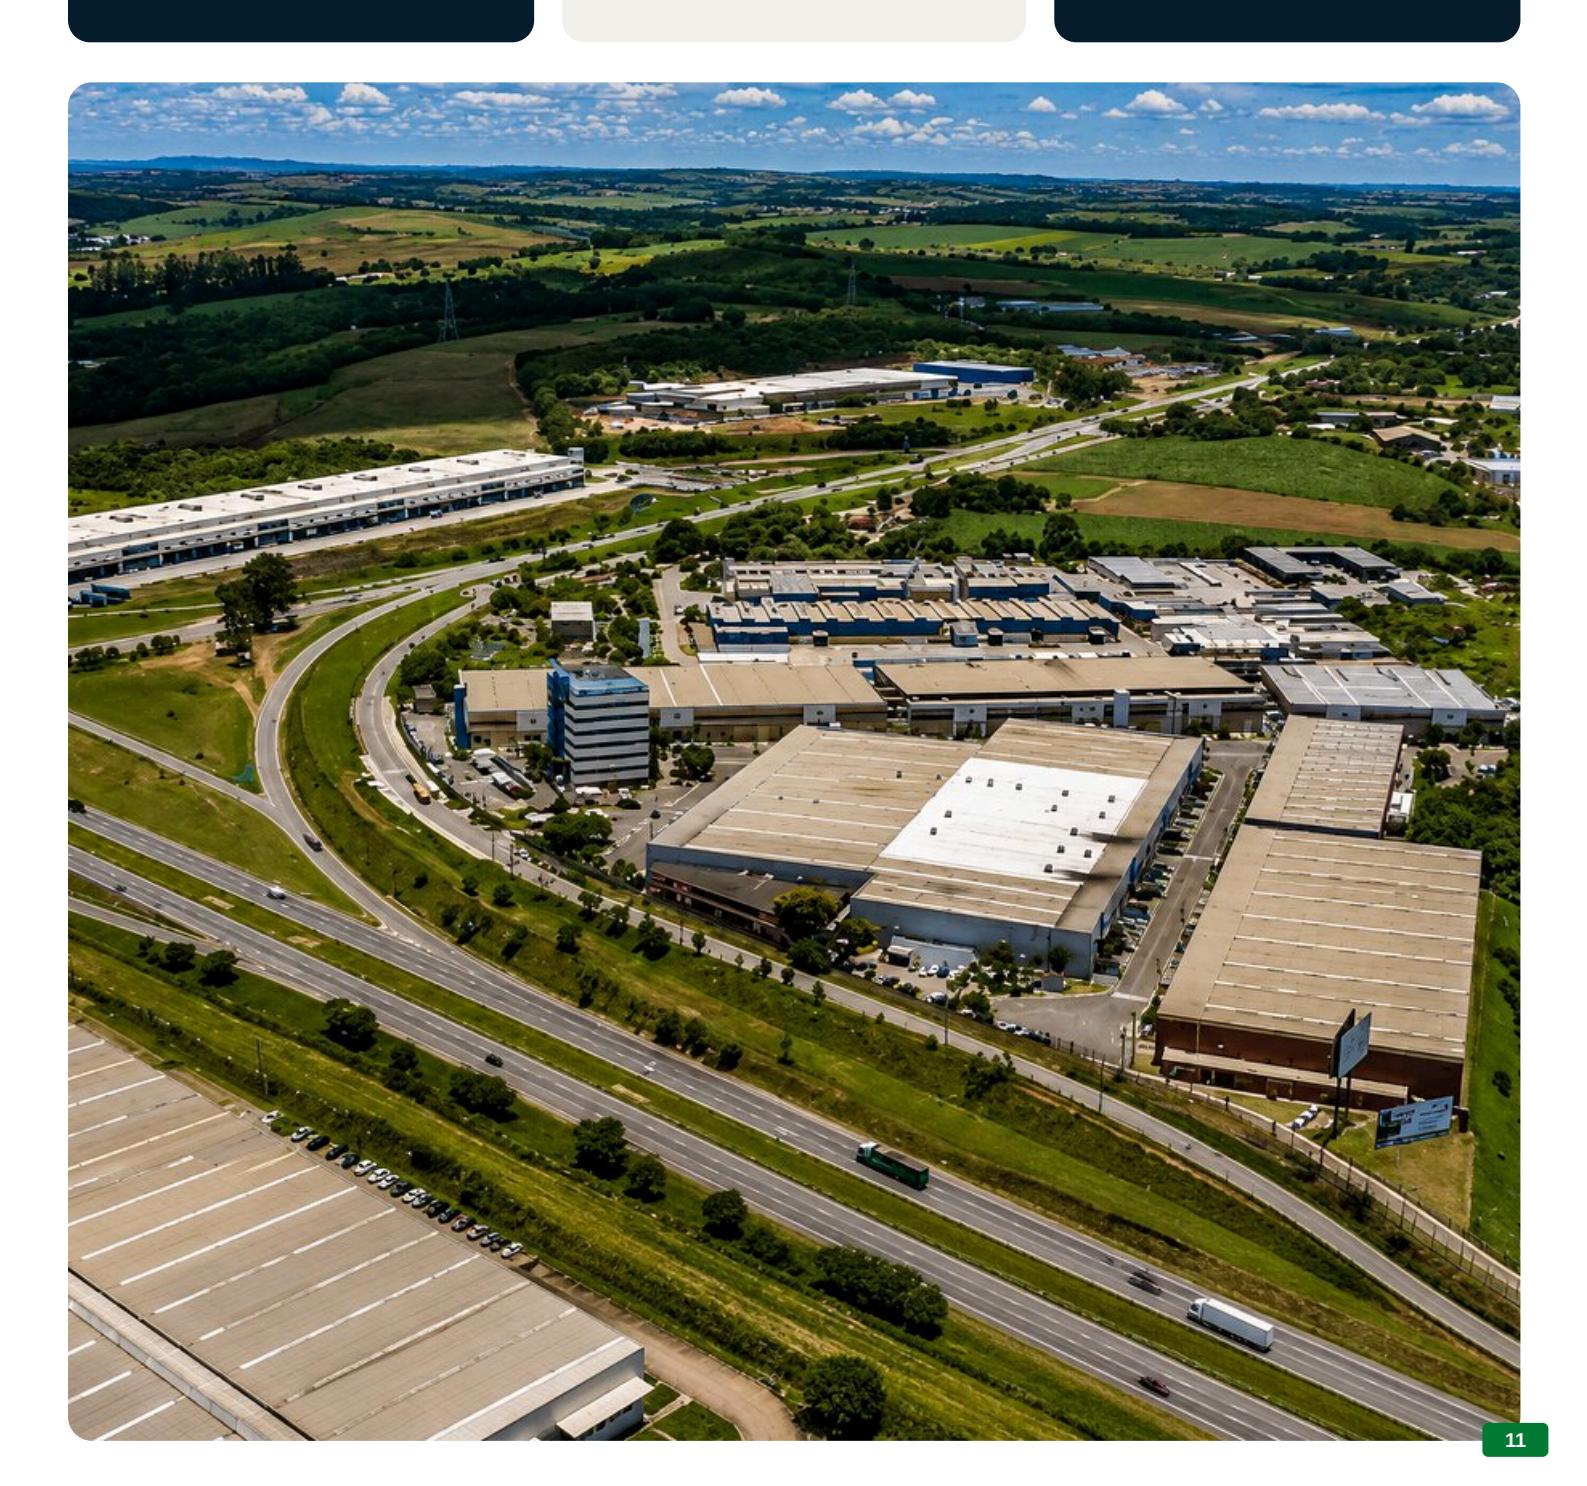
BBP - Extrema is located at Estrada Municipal Antônio Agostinho Barbosa, 1300, in the Bairro dos Pires district of Extrema, Minas Gerais. The development covers a total site of 117,956 sqm, of which 47,282 sqm is dedicated to leasing. The park offers highly configurable modules that adapt to different operating requirements, supporting business expansion and improved performance.
47,282 sqm
GLA built / under construction
— Development pad GLA
100%
Occupancy of completed properties
inVista Brazilian Business Park FII
MANAGEMENT REPORT · SEPTEMBER | 2026
This material is intended exclusively for the client and does not take into account their financial situation or individual needs. It also does not cover all the information a prospective investor should assess before making any investment decision. It was prepared by the fund management team of inVista Real Estate, drawing on public sources, internal data and other external information. This material must not be construed as securities research, promotional material, a public offering, investment advice, or a solicitation to buy or sell, nor as an investment recommendation.
Allocation decisions are the sole responsibility of the discretionary manager of the investment vehicle. We recommend that clients consult qualified professionals before making any investment in securities. Partial or full reproduction of this material is prohibited without the express authorisation of inVista, or unless the complete source is duly cited.
SÃO PAULO — BRAZIL
Rua Gomes de Carvalho, 1.507 — Bloco A, Conjunto 101 +55 11 3045 3773 · WhatsApp +55 11 9 1991-1234 [email protected] · invista.me
We thank our unitholders for their continued confidence.
For more information about our funds, write to [email protected] or visit invista.me