
Relatório gerencial em inglês TRXF11 de maio de 2026
Relatório gerencial em inglês do TRX Real Estate (TRXF11), fundo imobiliário híbrido, referente a maio de 2026, com entrega no FundosNet (B3) em 16/06/2026. No pregão de 03/11/2026, a cota do TRXF11 fechou a R$ 62,80, com P/VP de 0,65 (valor patrimonial de R$ 96,67 por cota no informe mensal de setembro de 2026). O último rendimento foi de R$ 0,93 por cota, com pagamento em nov/2026, e o dividend yield dos últimos 12 meses é de 18,79% sobre a cotação de 03/11/2026. O patrimônio líquido era de R$ 6 bilhões no informe mensal de setembro de 2026. Os indicadores são os mais recentes da base do Kartac, não os do período do documento.
Informações
- Fundo
- TRX REAL ESTATE RESPONSABILIDADE LIMITADA-10,82%
- CNPJ
- 28.548.288/0001-52
- Tipo
- Outras Informações
- Assunto
- Relatório gerencial em inglês
- Data de referência
- 29/05/2026
- Data de entrega
- 16/06/2026 16:12
- Versão
- 1
- Situação
- (Ativo)
Conteúdo
trx TRX REAL ESTATE REIT TRXF11
TRXF11 – 05/2026
TRX Investimentos
Founded in 2007, TRX has established itself as an independent Real Estate Investment Manager in Brazil, with a history of developing built-to-suit properties for some of the listed companies and in the acquisition of readyto-use properties that generate income in the sale and leaseback transactions. TRX's portfolio and track record are spread across the main markets in Brazil.
TRX Real Estate REIT – TRXF11
The REIT aims to generate income and capital appreciation through the acquisition, development, disposal and active management of real estate. It invests in properties located in strategic regions across various segments with high technical standards, leased to companies with strong credit risk profiles, preferably under long-term lease agreements.
Main Informations
Ticker: TRXF11
CNPJ: 28.548.288/0001-52
Anbima Classification: FII Renda Gestão Ativa
Management: TRX Gestora de Recursos
Administrator: BRL Trust Investimentos
Real Estate Consultant: TRX Desenvolvimento Imobiliário
REIT Inception: October 15, 2019
Management Fee: 1.00% per year on market value
Performance Fee: 20.00% of the surplus to the Benchmark
Benchmark: IPCA + 6.00% per year
Dividend Disclosure: Last business day of the month
Dividend Payment: 10th business day of the month
Market Maker: XP Investimentos
Investors Relations
E-mail: [email protected]
trx
TRX Real Estate REIT RETTOARATODOS-TUDO PARA ESPOR TRXF11 05/2026
Number of Emissions 12
Number of Shareholders 315,229
Market Price R$ 91.80 (BRL)
Equity Value per Share R$ 97.41 (BRL)
Distribution R$ 0.93 (BRL)
Number of Properties 124
Geographic Presence
Presence in 17 Brazilian states and 65 cities
Gross Leasable Area (GLA) 1,353,126.17 m²
Adjustment Index
IPCA 80.99%, IGP-M 6.11% and IGP-DI 2.39%
Average Rental Value per m²
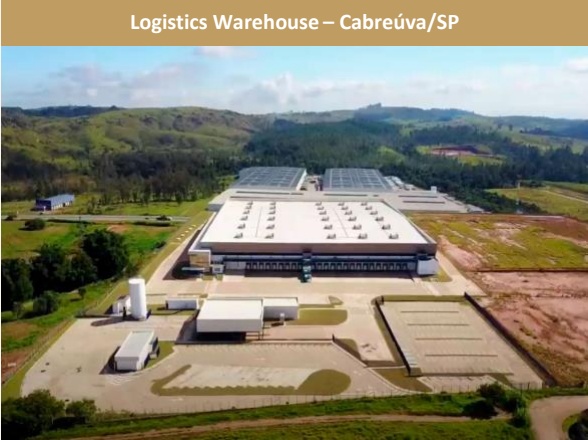
Retail R$ 32.43, Healthcare R$ 140.02, Logistics: R$ 30.34, Educational: R$ 41.76, Hospital R$ 104.28 and Shopping Mall: R$ 23.15
Issued Shares 62,430,702
Average Daily Liquidity
Market Value R$ 5,731,138,443.60 (BRL)
Equity Value R$ 6,081,752,802.86 (BRL)
Monthly and Annualized Dividend Yield 1.01% / 12.16%
Number of Tenants 383
Land Area 2,796,133.46 m²
Revenue by Contract Type Atypical 73.37% and Typical 26.53%
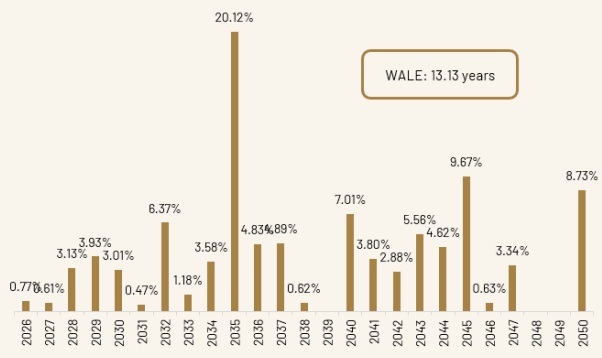
Wale 13.16 years
Asset Value per m²
Retail R$ 5,128.57, Healthcare R$ 23,029.66, Logistics R$ 3,987.75, Educational R$ 5,769.01, Hospital R$ 23,562.93 and Shopping Mall R$ 6,086.60
Vacancy Physical 0.67% and Financial 0.42%
Highlights of the Month
TRXF11 – 05/2026

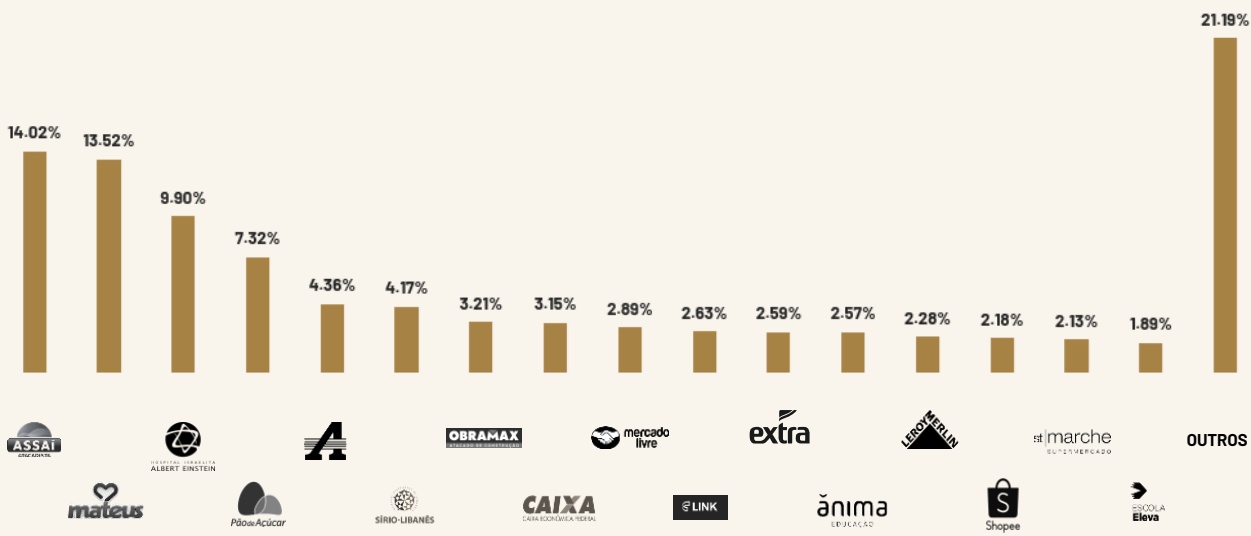
TRXF11 Signs MOU for the Sale of 2 Leased Assets to Grupo Pão de Açúcar with Net Profit Above R$24 Million
On May 20, TRXF11 (Brazilian REIT) signed a Memorandum of Understanding for the sale of two retail assets leased to Grupo Pão de Açúcar, both located in Goiânia/GO.
The sale value is approximately R$74 million, which corresponds to a net profit of R$24.5 million. The transaction is expected to generate an approximate profit of R$0.39 per share, while also supporting deleveraging, reducing tenant concentration, enhancing portfolio diversification, and enabling capital recycling.
It also demonstrates the REIT’s ability to monetize assets even under potentially challenging tenant scenarios, reinforcing the portfolio’s liquidity and asset quality.

TRXF11 Completes Acquisition of Property Leased to Sírio-Libanês Hospital Located in São Paulo/SP
On May 29, TRXF11 completed the acquisition of nine floors in Torre Orvalho, at Complexo O Parque, currently leased to Sírio-Libanês Hospital, with a lease agreement valid until 2054.
The purchase price of the property is R$219 million, while the estimated capex for the project is estimated at R$109 million.

Monthly Distribution
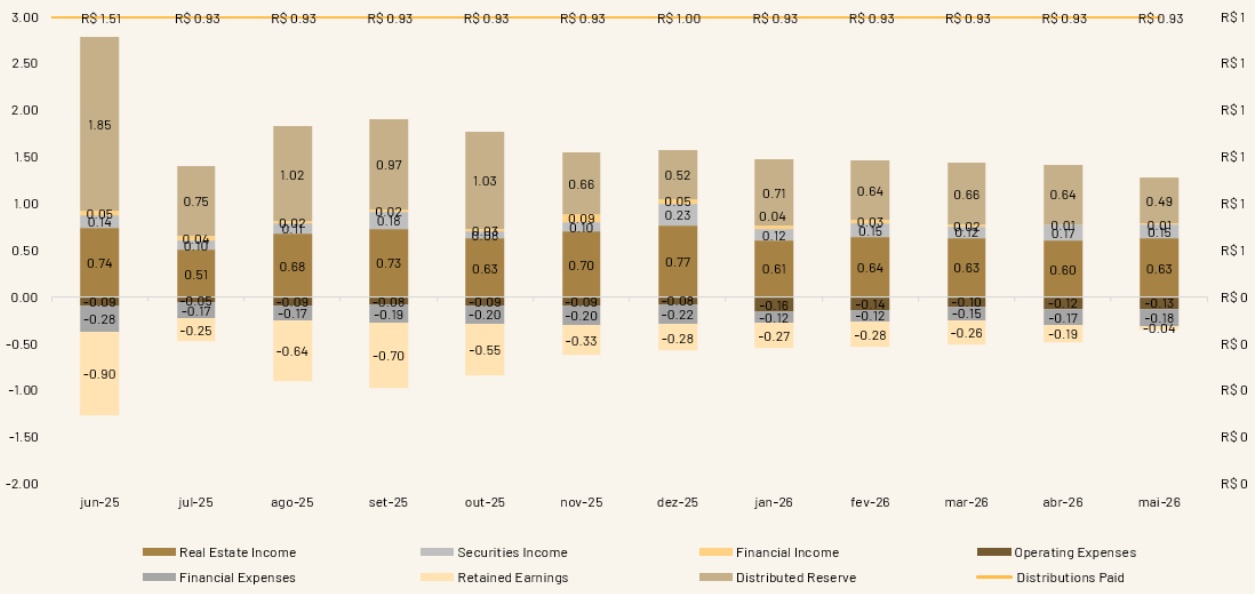
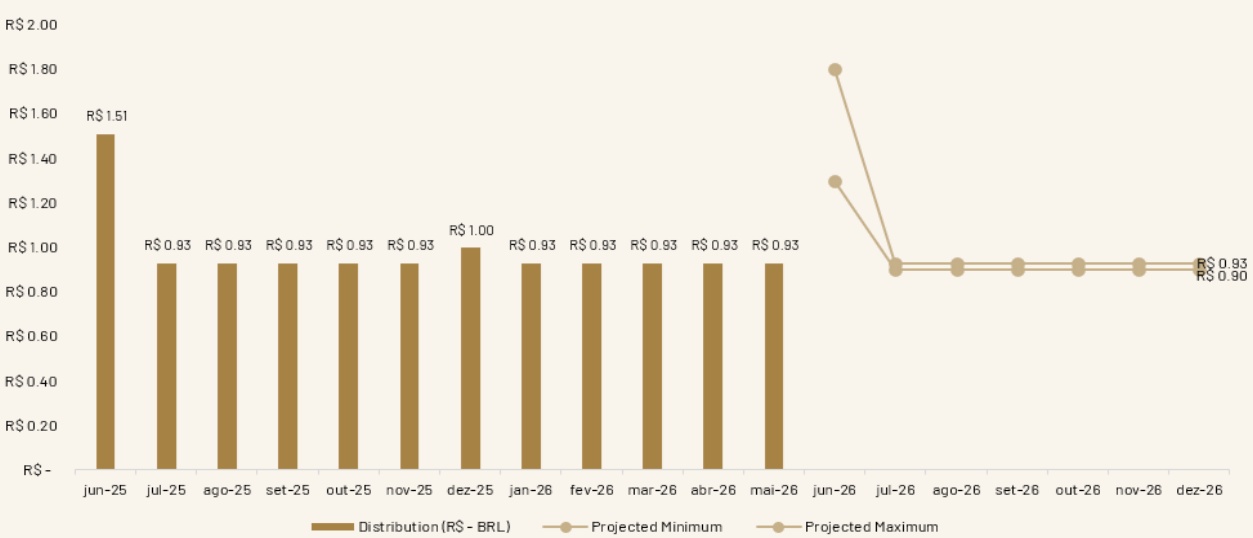
R$0.93 per share, equivalent to a monthly yield of 1.01% (12.16% per year) based on a closing price of R$91.80.
The payment will be made on June 15, 2026, to investors holding shares as of May 29, 2026.
Distribution guidance remains in the range of R$0.90–R$0.93 per share through December 2026. An extraordinary dividend for June is also expected, estimated between R$1.30 and R$1.80 per share.
STATEMENT OF OPERATIONS (R$ - BRL)
| Accounting Entry | December/25 | January/26 | February/26 | March/26 | April/26 | May/26 | CSuixm-uMloantitvhe | Trailing 12 Months |
|---|---|---|---|---|---|---|---|---|
| RentalIncome | 25,067,542.79 | 38,131,170.93 | 40,206,224.63 | 39,586,996.69 | 37,574,318.45 | 39,122,537.60 | 194,621,248.30 | 340,243,804.51 |
| IndirectPropertyIncome | 24,464,227.45 | 35,088,616.58 | 22,966,209.63 | 23,833,237.82 | 23,596,482.90 | 18,688,204.33 | 124,172,751.26 | 213,126,258.80 |
| Total PropertyIncome | 49,531,770.25 | 73,219,787.51 | 63,172,434.26 | 63,420,234.51 | 61,170,801.35 | 57,810,741.93 | 318,793,999.56 | 553,370,063.31 |
| SecuritiesIncome | 7,512,562.38 | 7,412,926.65 | 9,083,620.91 | 7,716,203.04 | 10,776,473.41 | 9,260,666.94 | 44,249,890.94 | 72,896,721.71 |
| Interest Income | 1,598,007.86 | 2,486,523.68 | 2,075,919.88 | 1,064,943.60 | 454,066.94 | 603,058.61 | 6,684,512.71 | 15,841,163.49 |
| Total Revenues | 58,642,340.48 | 83,119,237.84 | 74,331,975.05 | 72,201,381.14 | 72,401,341.69 | 67,674,467.48 | 369,728,403.21 | 642,107,948.51 |
| Operating Expenses (-) | 2,485,537.97 | 9,799,228.18 | 8,579,058.58 | 6,102,774.50 | 7,724,839.95 | 7,823,194.52 | 40,029,095.73 | 57,272,355.83 |
| InterestExpenses (-)* | 7,011,433.85 | 7,202,393.85 | 7,450,487.67 | 9,266,910.83 | 10,762,207.56 | 11,245,991.12 | 45,927,991.03 | 88,764,614.70 |
| Total Expenses | 9,496,971.82 | 17,001,622.03 | 16,029,546.25 | 15,369,685.33 | 18,487,047.51 | 19,069,185.64 | 85,957,086.76 | 146,036,970.54 |
| OperatingIncome (EBITDA Proxy) | 50,013,771.42 | 66,117,615.81 | 58,302,428.80 | 56,831,695.81 | 53,914,294.18 | 48,605,281.84 | 283,771,316.45 | 496,939,380.72 |
| OperatingProfit per Share | 1.54 | 1.06 | 0.93 | 0.91 | 0.86 | 0.78 | 4.55 | 7.96 |
| Distribution | 32,493,284.00 | 58,060,552.86 | 58,060,552.86 | 58,060,552.86 | 58,060,552.86 | 58,060,552.86 | 290,302,764.30 | 504,143,519.03 |
| Distributionper Share | 1.00 | 0.93 | 0.93 | 0.93 | 0.93 | 0.93 | 4,65 | 11.81 |
| Dividend Yield | 1.02% | 0.97% | 1.00% | 1.01% | 1.02% | 1.01% | 5.07% | 12.86% |
| Total Accumulated Return | 12,135,460.00 | 20,192,522.95 | 20,434,398.89 | 19,205,541.84 | 15,059,283.16 | 9,455,271.02 | 9,455,271.02 | 9,455,271.02 |
| Accumulated Returnper Share | 0.37 | 0.32 | 0.33 | 0.31 | 0.24 | 0.15 | 0.15 | 0.15 |
*Refers to interest expense of securitizations.
100.00% Operating Income (EBITDA proxy) from Real Estate
RESULTS (R$/SHARE) – LAST 12 MONTHS
SHARE DISTRIBUTION HISTORY IN THE LAST 12 MONTHS AND GUIDANCE
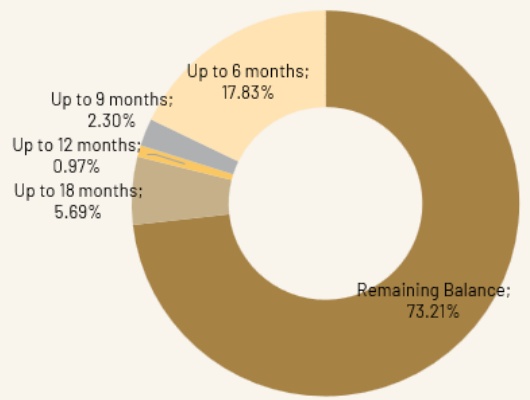
PENALTY + NOTICE PERIOD (% OF REVENUE)
LEASE EXPIRATION SCHEDULE (% OF REVENUE)
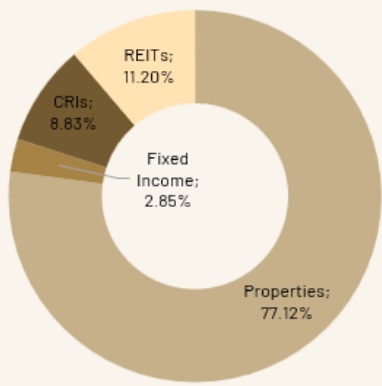
ALLOCATION OF RESOURCES (% OF NET ASSET VALUE)
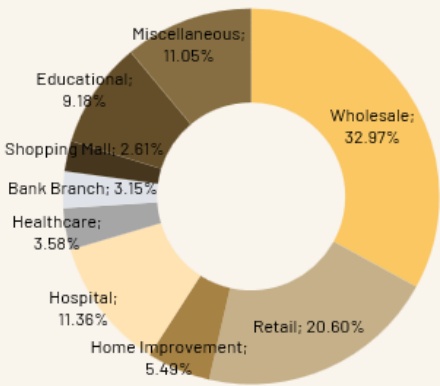
BUSINESS SEGMENT (% INCOME)
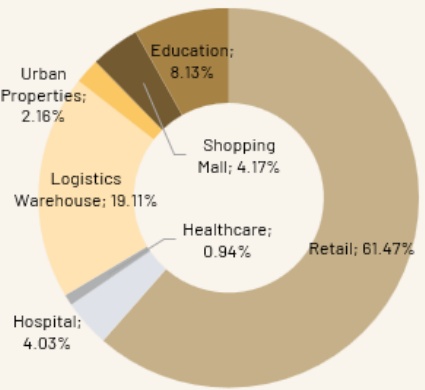
PROPERTY PROFILE (% GLA)
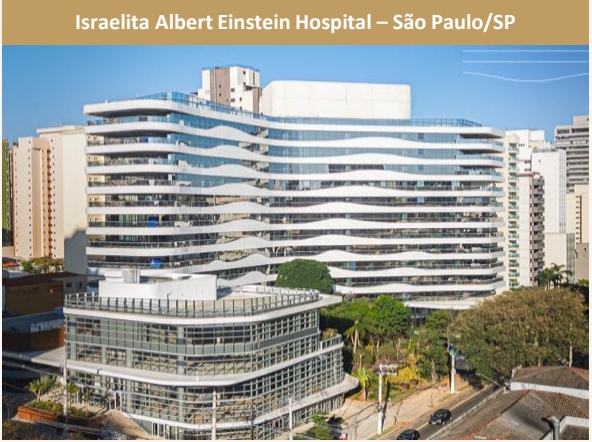
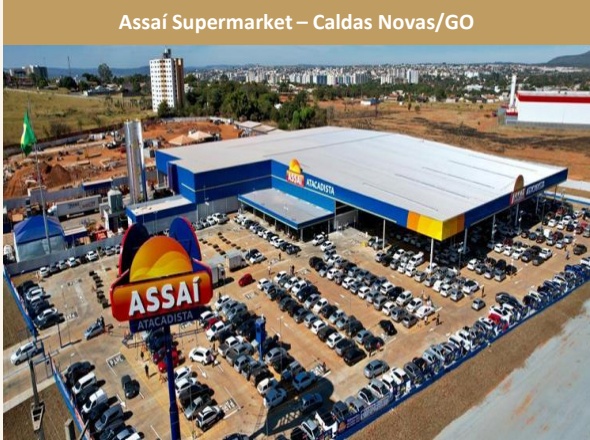
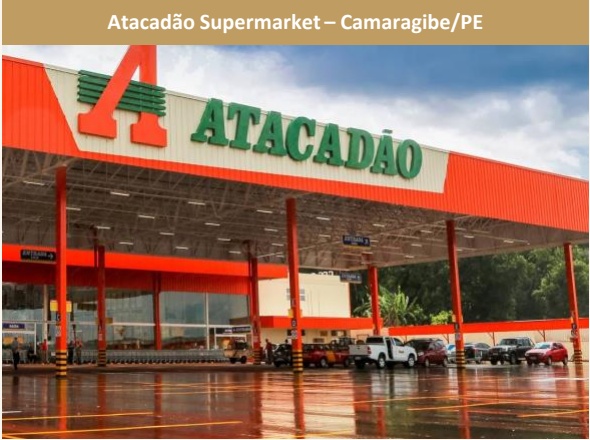
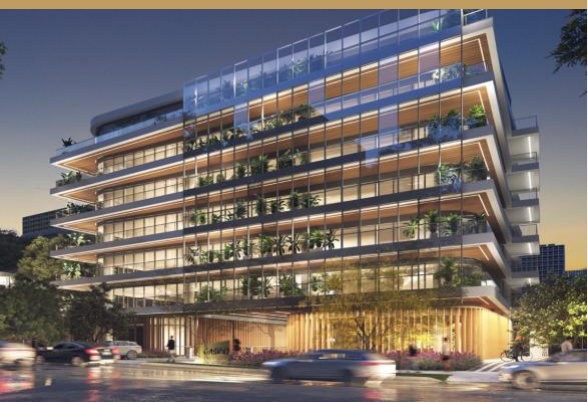
Link School of Business University – São Paulo/SP
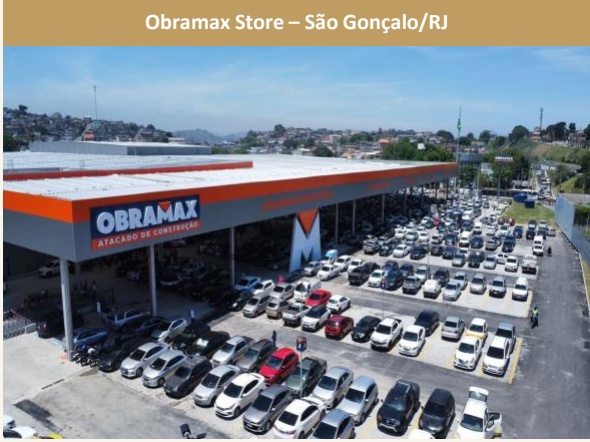
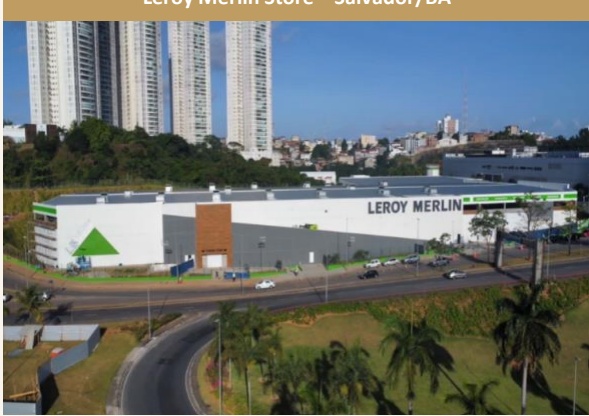
Leroy Merlin Store – Salvador/BA
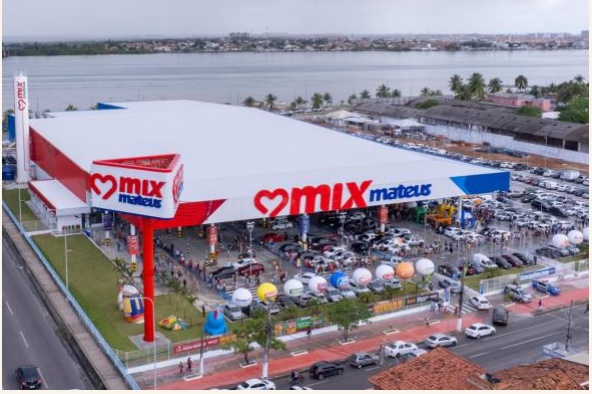
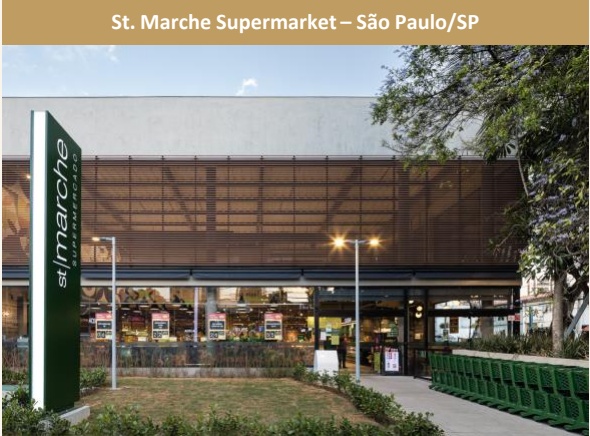
Grupo Mateus Supermarket– Aracaju/SE
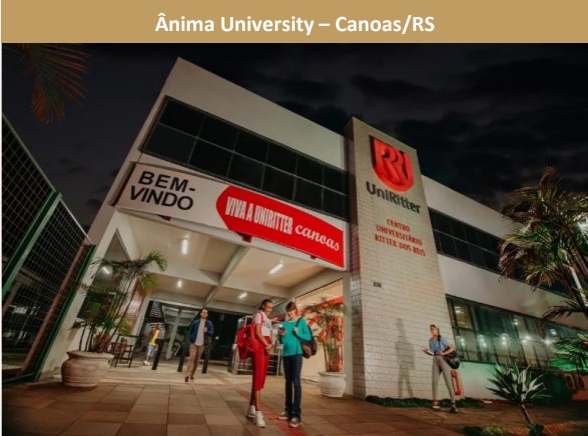
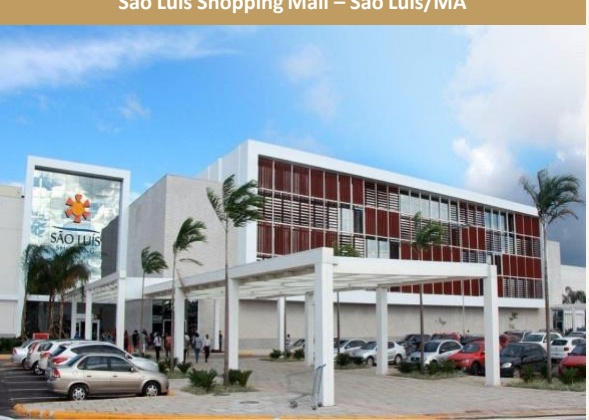
São Luís Shopping Mall – São Luís/MA
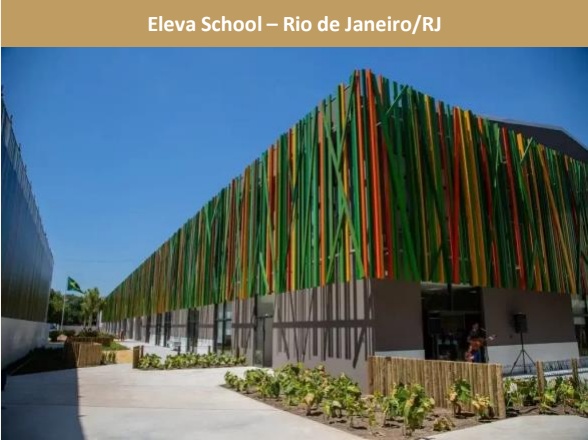
Eleva School – Rio de Janeiro/RJ
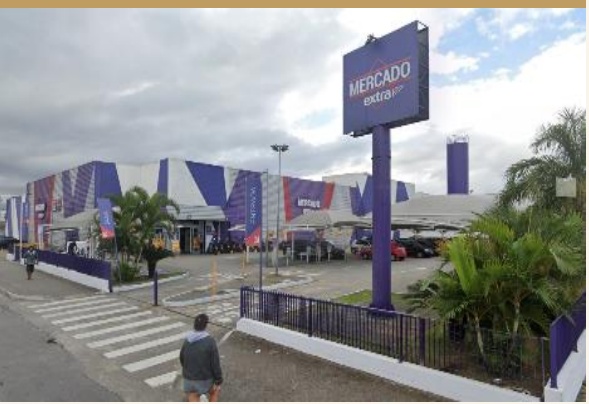
Extra Supermarket– Praia Grande/SP
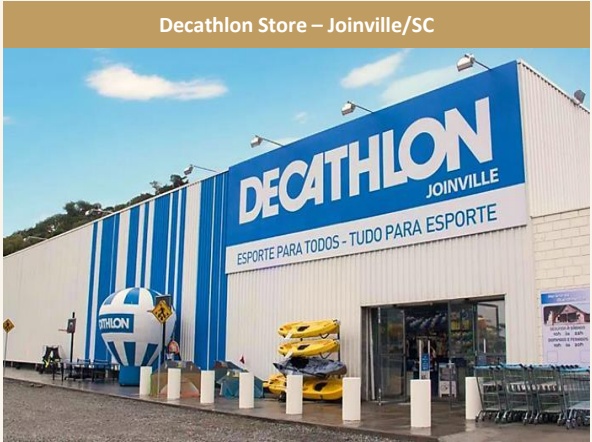
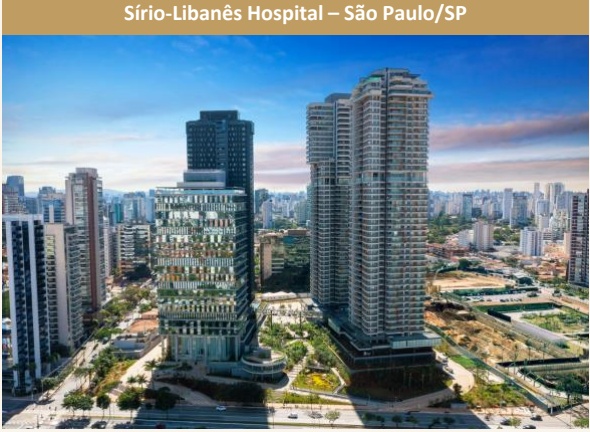
Einstein Hospital Israelita – São Paulo/SP*
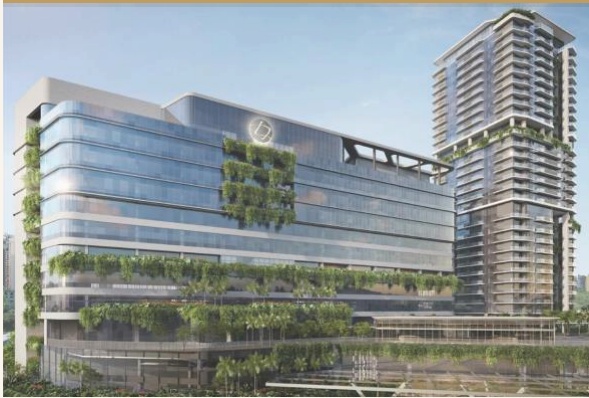
*Property under construction.
Disclaimer
This report is provided solely for informational purposes and should not be construed as, nor is it intended to constitute, an offer or solicitation to buy or sell securities, financial instruments, or participation in any specific business strategy, regardless of jurisdiction.
The opinions, estimates, and projections expressed in this report reflect the current judgment of the individual responsible for its content as of the date of publication and are therefore subject to change without prior notice. The projections use historical data and assumptions, and the following disclaimers should be observed:
(1) They are not free from errors;
(2) There is no guarantee that the scenarios presented will actually occur;
(3) They do not, under any circumstances, constitute a promise or guarantee of expected return or maximum loss exposure; and
(4) They should not be used to support any administrative procedure before regulatory or supervisory bodies.
Read the Prospectus, the Supplementary Information Form, the Key Information Sheet, and the regulations before investing. Past performance does not guarantee future returns. The disclosed returns are not net of taxes.
Investment funds are not guaranteed by the Administrator, the Manager, any insurance mechanism, or the Credit Guarantee Fund (FGC).