
Outros Relatórios TRXF11 de 30/09/2026
Outros Relatórios do TRX Real Estate (TRXF11), fundo imobiliário híbrido, com data de referência em 30/09/2026, com entrega no FundosNet (B3) em 22/10/2026. No pregão de 03/11/2026, a cota do TRXF11 fechou a R$ 62,80, com P/VP de 0,65 (valor patrimonial de R$ 96,67 por cota no informe mensal de setembro de 2026). O último rendimento foi de R$ 0,93 por cota, com pagamento em nov/2026, e o dividend yield dos últimos 12 meses é de 18,79% sobre a cotação de 03/11/2026. O patrimônio líquido era de R$ 6 bilhões no informe mensal de setembro de 2026. Os indicadores são os mais recentes da base do Kartac, não os do período do documento.
Informações
- Fundo
- TRX REAL ESTATE RESPONSABILIDADE LIMITADA-10,82%
- CNPJ
- 28.548.288/0001-52
- Tipo
- Relatórios
- Assunto
- Outros Relatórios
- Data de referência
- 30/09/2026
- Data de entrega
- 22/10/2026 09:48
- Versão
- 1
- Situação
- (Ativo)
Conteúdo

TRX REAL ESTATE REIT TRXF11
INVESTOR SEPTEMBER REPORT 2026
TRX Real Estate REIT TRXF11 – 09/2026
TRX Investimentos
Founded in 2007, TRX is an independent real estate investment manager specializing in the origination, structuring, development, acquisition, and management of real estate assets in Brazil. With nearly two decades of experience, the firm has established a strong track record across multiple real estate strategies and asset classes.
Throughout its history, TRX has built significant expertise in Built-to-Suit, SaleLeaseback, real estate development, and the acquisition of income-generating properties. The company has partnered with some of Brazil’s leading corporations, executing transactions across a diverse range of property sectors and investment profiles.
TRX Real Estate REIT – TRXF11
REIT focused on delivering recurring income and long-term value creation through active portfolio management. The REIT combines strategic property acquisitions, real estate transaction structuring, and portfolio recycling, with an emphasis on predictable cash flows and sustainable dividend distributions to its shareholders.
Main Informations Ticker: TRXF11 CNPJ: 28.548.288/0001-52 Anbima Classification: FII Renda Gestão Ativa Management: TRX Gestora de Recursos Administrator: BRL Trust Investimentos Real Estate Consultant: TRX Desenvolvimento Imobiliário REIT Inception: October 15, 2019 Management Fee: 1.00% per year on market value Performance Fee: 20.00% of the surplus to the Benchmark Benchmark: IPCA + 6.00% per year Dividend Disclosure: Last business day of the month Dividend Payment: 10th business day of the month Market Maker: XP Investimentos
Investors Relations E-mail: [email protected]

TRX Real Estate REIT TRXF11 – 09/2026
Number of Emissions
Issued Shares
13 62,430,702
Number of Shareholders
Average Daily Liquidity
354,486 BRL 30.45 million
Market Price
BRL 71.79
Market Value
BRL 4,450,684,745.58
Equity Value per Share
BRL 95.99
Equity Value
BRL 5,992,723,084.98
Distribution
BRL 0.93
Monthly and Annualized Dividend Yield 1.30% / 15.55%
Number of Properties
129
Number of Tenants
1,375
Geographic Presence
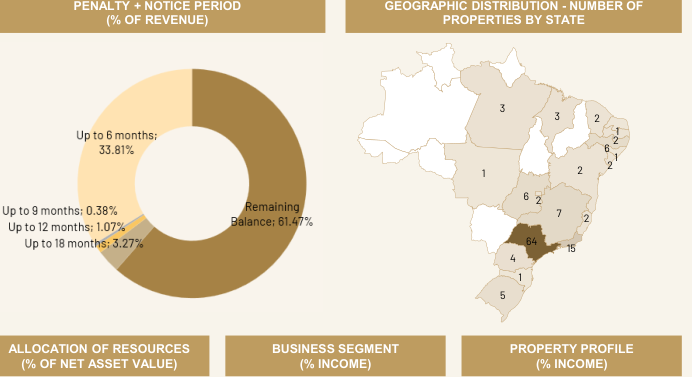
Presence in 19 Brazilian states and 67 cities
Land Area
5,975,121.24 m²
Revenue by Contract Type
Gross Leasable Area (GLA)
2,051,308.13 m²
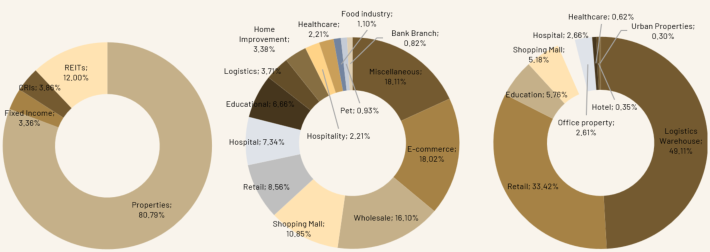
Atypical 56.53%, Typical Logistics 15.42%, Typical Shopping Mall 12.22% and Typical Commercial 15.83%
Adjustment Index
IPCA 82.64%, IGP-M 3.49%
Wale
11.06 years
Average Rental Value per m²
Retail: BRL 33.13, Healthcare: BRL 140.20, Logistics: BRL 29.64, Educational: BRL 45.69, Hospital: BRL 109.27, Shopping Mall: BRL 82.82, Hotel: BRL 248.72 and Office Property BRL 76.60
Asset Value per m²
Retail: BRL 5,204.78, Healthcare: BRL 23,029.66, Logistics: BRL 4,455.62, Educational: BRL 6,465.64, Hospital: BRL 23,562.93, Shopping Mall: BRL 13,826.28, Hotel: BRL 36.093,82 and Office Property BRL 10,990.73
Base date: 09/30/2026
Highlights of the Month TRXF11 – 09/2026

TRXF11 Completes its 13th Unit Issuance
Following the completion of its 13th Unit Issuance, which raised R$ 3.16 billion, TRXF11 reached another important milestone in its history, significantly increasing the scale and diversification of its portfolio. The proceeds were allocated to the acquisition of real estate assets across different property types, regions, and occupancy profiles, expanding the REIT’s income-generating sources and reducing reliance on individual exposures.
In addition, R$ 2.63 billion of the acquisitions were settled through the offsetting of sellers’ receivables against the subscription of new units, contributing to the preservation of the REIT’s cash position.

Active Management and Portfolio Recycling
In line with its asset recycling strategy, the REIT completed the sale of a Grupo Pão de Açúcar property in Goiânia/GO and a portfolio of 15 properties, including branches leased to Caixa Econômica Federal. These transactions reinforce TRXF11’s active management approach, focused on realizing capital gains from mature and/or non-core assets and reinvesting the proceeds into new opportunities aligned with the REIT’s strategy.
As part of its ongoing portfolio recycling strategy, negotiations are currently underway regarding potential asset disposals totaling approximately R$ 500 million.

Monthly Distribution
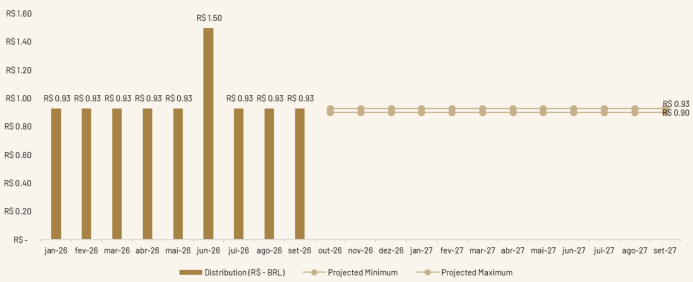
TRXF11 announced a distribution of R$ 0.93 per unit, equivalent to a monthly yield of 1.30% and an annualized yield of 15.55%.
The distribution will be paid on October 15 to investors holding units at the close of trading on September 30.
In addition, the projected distribution range for the next 12 months remains between R$ 0.90 and R$ 0.93 per unit.
STATEMENT OF OPERATIONS (BRL)
| Accounting Entry | April/26 | May/26 | June/26 | July/26 | August/26 | September/26 | Six-Month Cumulative | Trailing 12 Month | s |
|---|---|---|---|---|---|---|---|---|---|
| RentalIncome¹ | 37,574,318.45 | 39,122,537.60 | 134,335,656.09 | 40,669,247.37 | 40,619,955.52 | 72,793,321.35 | 154,082,524.24 | 551,323,936.46 | |
| Indirect Property Income² | 19,881,653.12 | 18,960,095.34 | 11,898,686.51 | 44,327,836.23 | 43,791,705.14 | 26,245,445.21 | 114,364,986.58 | 291,873,240.81 | |
| Total Property Income | 57,455,971.58 | 58,082,632.94 | 146,234,342.60 | 84,997,083.60 | 84,411,660.66 | 99,038,766.56 | 268,447,510.81 | 843,197,177.27 | 94.79% ~~>~~ |
| SecuritiesIncome³ | 14,491,303.18 | 8,988,775.93 | -6,895,912.70 | -5,406,869.79 | -14,713,246.30 | -1,201,921.44 | -21,322,037.54 | 31,440,446.31 | Total Property |
| Interest Income⁴ | 454,066.94 | 586,551.36 | 456,821.01 | 682,791.72 | 527,717.49 | 1,253,811.36 | 2,464,320.58 | 14,872,322.46 | Income vs Total Revenues |
| Total Revenues | 72,401,341.69 | 67,657,960.23 | 139,795,250.91 | 80,273,005.53 | 70,226,131.84 | 99,090,656.48 | 249,589,793.85 | 889,509,946.04 | |
| Operating Expenses (-) | 7,724,839.95 | 7,823,194.52 | 6,544,415.79 | 5,005,112.93 | 7,428,707.24 | 6,501,834.97 | 18,935,655.14 | 73,750,276.48 | |
| Interest Expenses (-) ⁵ | 10,762,207.56 | 11,245,991.12 | 11,358,860.99 | 15,293,980.34 | 17,648,281.53 | 18,373,394.94 | 51,315,656.81 | 128,588,411.79 | |
| Total Expenses | 18,487,047.51 | 19,069,185.64 | 17,903,276.78 | 20,299,093.27 | 25,076,988.77 | 24,875,229.91 | 70,251,311.95 | 202,338,688.27 | |
| Operating Income (EBITDA Proxy) | 53,914,294.18 | 48,588,774.59 | 121,891,974.13 | 59,973,912.26 | 45,149,143.08 | 74,215,426.57 | 179,338,481.90 | 688,039,660.52 | |
| Operating Profit per Share | 0.86 | 0.78 | 1.95 | 0.96 | 0.72 | 1.19 | 2.87 | 12.54 | 100.00% ~~—~~ |
| Distribution | 0.00 | 0.00 | 0.00 | 0.00 | 38,785.82 | 7,253,370.34 | 7,292,156.15 | 31,094,994.86 | Operating Income (EBITDA ) |
| Receipt | 58,060,552.86 | 58,060,552.86 | 93,646,053.00 | 58,060,552.86 | 58,060,552.86 | 58,060,552.86 | 174,181,658.58 | 651,061,268.12 | proxy from Real Estate |
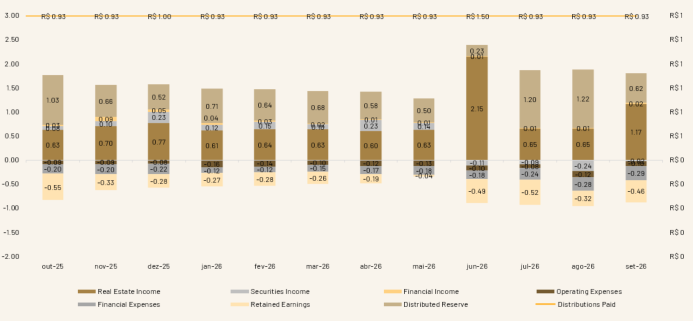
| Distribution per Share | 0.93 | 0.93 | 1.50 | 0.93 | 0.93 | 0.93 | 2.79 | 11.80 | |
| Dividend Yield | 1.02% | 1.01% | 1.63% | 1.02% | 1.17% | 1.30% | 3.89% | 16.44% | |
| Total AccumulatedReturn | 15,059,283.16 | 5,587,504.89 | 33,833,426.02 | 35,746,785.42 | 22,796,589.82 | 31,698,093.19 | 31,698,093.19 | 31,698,093.19 | |
| AccumulatedReturn per Share | 0.24 | 0.09 | 0.54 | 0.57 | 0.37 | 0.51 | 0.51 | 0.51 |
¹Rental Income: comprises rental income generated by properties directly owned by TRXF11, as well as extraordinary income arising from property disposals with installment payment structures. ²Indirect Property Income: comprises dividends received from the REITs in which TRXF11 is the majority investor, such as TRXB11, HIRE11 and CLSM11, as well as capital gains realized from the trading of these REITs. ³Securities Income: comprises income generated by the CRI (Real Estate Receivables Certificate) portfolio and dividends received from other REITs. ⁴Interest Income: comprises returns earned from financial investments in sovereignfunds. ⁵ InterestExpenses(-): comprisesinterestexpensesand costs relatedto securitizationtransactions.
RESULTS (BRL/SHARE) – LAST 12 MONTHS
SHARE DISTRIBUTION AND GUIDANCE
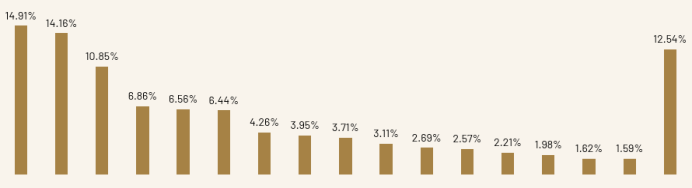
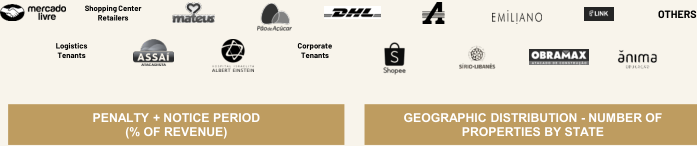
MONTHY RENTAL INCOME PER TENANT
/>
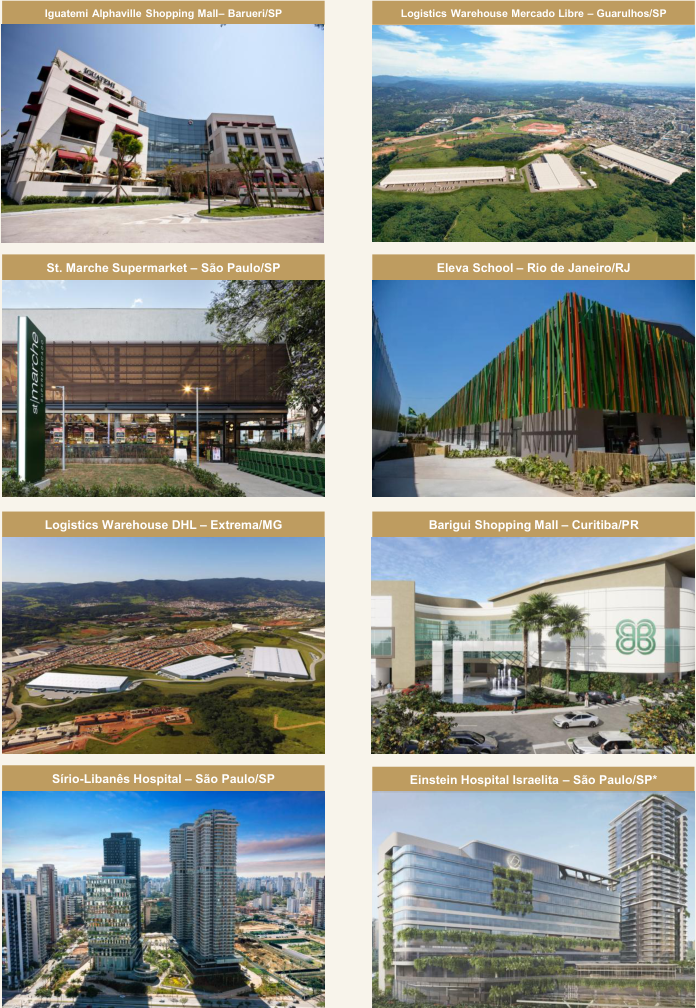
*Property under construction.
Disclaimer
This report is provided solely for informational purposes and should not be construed as, nor is it intended to constitute, an offer or solicitation to buy or sell securities, financial instruments, or participation in any specific business strategy, regardless of jurisdiction.
The opinions, estimates, and projections expressed in this report reflect the current judgment of the individual responsible for its content as of the date of publication and are therefore subject to change without prior notice. The projections use historical data and assumptions, and the following disclaimers should be observed:
(1) They are not free from errors;
(2) There is no guarantee that the scenarios presented will actually occur;
(3) They do not, under any circumstances, constitute a promise or guarantee of expected return or maximum loss exposure; and
(4) They should not be used to support any administrative procedure before regulatory or supervisory bodies.
Read the Prospectus, the Supplementary Information Form, the Key Information Sheet, and the regulations before investing. Past performance does not guarantee future returns. The disclosed returns are not net of taxes.
Investment funds are not guaranteed by the Administrator, the Manager, any insurance mechanism, or the Credit Guarantee Fund (FGC).